Syrian vs English Disability Age Under 5
COMPARE
Syrian
English
Disability Age Under 5
Disability Age Under 5 Comparison
Syrians
English
1.3%
DISABILITY AGE UNDER 5
16.1/ 100
METRIC RATING
215th/ 347
METRIC RANK
1.7%
DISABILITY AGE UNDER 5
0.0/ 100
METRIC RATING
311th/ 347
METRIC RANK
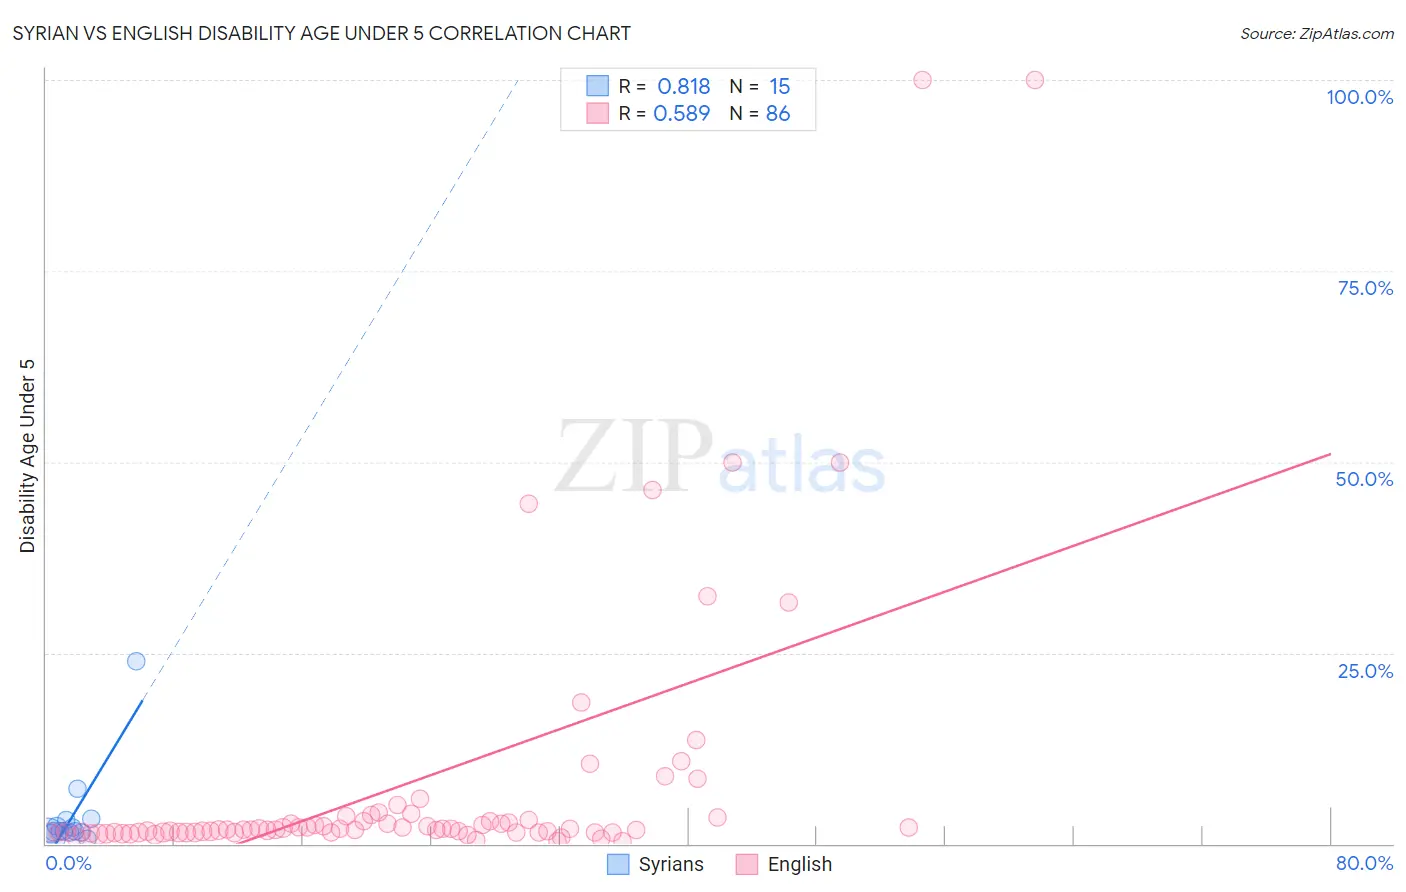
Syrian vs English Disability Age Under 5 Correlation Chart
The statistical analysis conducted on geographies consisting of 161,568,147 people shows a very strong positive correlation between the proportion of Syrians and percentage of population with a disability under the age of 5 in the United States with a correlation coefficient (R) of 0.818 and weighted average of 1.3%. Similarly, the statistical analysis conducted on geographies consisting of 261,226,703 people shows a substantial positive correlation between the proportion of English and percentage of population with a disability under the age of 5 in the United States with a correlation coefficient (R) of 0.589 and weighted average of 1.7%, a difference of 29.9%.
Disability Age Under 5 Correlation Summary
| Measurement | Syrian | English |
| Minimum | 0.60% | 0.36% |
| Maximum | 23.9% | 100.0% |
| Range | 23.3% | 99.6% |
| Mean | 3.6% | 7.8% |
| Median | 1.7% | 1.9% |
| Interquartile 25% (IQ1) | 1.5% | 1.5% |
| Interquartile 75% (IQ3) | 3.1% | 3.2% |
| Interquartile Range (IQR) | 1.7% | 1.7% |
| Standard Deviation (Sample) | 5.8% | 17.9% |
| Standard Deviation (Population) | 5.6% | 17.8% |
Similar Demographics by Disability Age Under 5
Demographics Similar to Syrians by Disability Age Under 5
In terms of disability age under 5, the demographic groups most similar to Syrians are Bangladeshi (1.3%, a difference of 0.10%), Immigrants from Chile (1.3%, a difference of 0.17%), Cypriot (1.3%, a difference of 0.20%), Immigrants from Sudan (1.3%, a difference of 0.40%), and Chilean (1.3%, a difference of 0.41%).
| Demographics | Rating | Rank | Disability Age Under 5 |
| Mexicans | 20.8 /100 | #208 | Fair 1.3% |
| Bulgarians | 19.5 /100 | #209 | Poor 1.3% |
| Pakistanis | 19.4 /100 | #210 | Poor 1.3% |
| Immigrants | Greece | 19.1 /100 | #211 | Poor 1.3% |
| Chileans | 18.8 /100 | #212 | Poor 1.3% |
| Immigrants | Sudan | 18.7 /100 | #213 | Poor 1.3% |
| Immigrants | Chile | 17.2 /100 | #214 | Poor 1.3% |
| Syrians | 16.1 /100 | #215 | Poor 1.3% |
| Bangladeshis | 15.5 /100 | #216 | Poor 1.3% |
| Cypriots | 14.9 /100 | #217 | Poor 1.3% |
| Malaysians | 13.2 /100 | #218 | Poor 1.3% |
| Immigrants | Croatia | 11.2 /100 | #219 | Poor 1.3% |
| Serbians | 9.6 /100 | #220 | Tragic 1.3% |
| Sub-Saharan Africans | 8.3 /100 | #221 | Tragic 1.3% |
| Ukrainians | 8.3 /100 | #222 | Tragic 1.3% |
Demographics Similar to English by Disability Age Under 5
In terms of disability age under 5, the demographic groups most similar to English are Puerto Rican (1.7%, a difference of 0.040%), Celtic (1.7%, a difference of 0.20%), Norwegian (1.7%, a difference of 0.36%), White/Caucasian (1.7%, a difference of 0.59%), and Dutch (1.7%, a difference of 0.62%).
| Demographics | Rating | Rank | Disability Age Under 5 |
| Seminole | 0.0 /100 | #304 | Tragic 1.6% |
| Blackfeet | 0.0 /100 | #305 | Tragic 1.6% |
| Creek | 0.0 /100 | #306 | Tragic 1.6% |
| Scottish | 0.0 /100 | #307 | Tragic 1.6% |
| Navajo | 0.0 /100 | #308 | Tragic 1.6% |
| Cape Verdeans | 0.0 /100 | #309 | Tragic 1.7% |
| Whites/Caucasians | 0.0 /100 | #310 | Tragic 1.7% |
| English | 0.0 /100 | #311 | Tragic 1.7% |
| Puerto Ricans | 0.0 /100 | #312 | Tragic 1.7% |
| Celtics | 0.0 /100 | #313 | Tragic 1.7% |
| Norwegians | 0.0 /100 | #314 | Tragic 1.7% |
| Dutch | 0.0 /100 | #315 | Tragic 1.7% |
| Immigrants | Cabo Verde | 0.0 /100 | #316 | Tragic 1.7% |
| French | 0.0 /100 | #317 | Tragic 1.7% |
| Irish | 0.0 /100 | #318 | Tragic 1.7% |