Immigrants from Yemen vs Nicaraguan Disability Age 35 to 64
COMPARE
Immigrants from Yemen
Nicaraguan
Disability Age 35 to 64
Disability Age 35 to 64 Comparison
Immigrants from Yemen
Nicaraguans
14.0%
DISABILITY AGE 35 TO 64
0.0/ 100
METRIC RATING
306th/ 347
METRIC RANK
10.2%
DISABILITY AGE 35 TO 64
99.1/ 100
METRIC RATING
87th/ 347
METRIC RANK
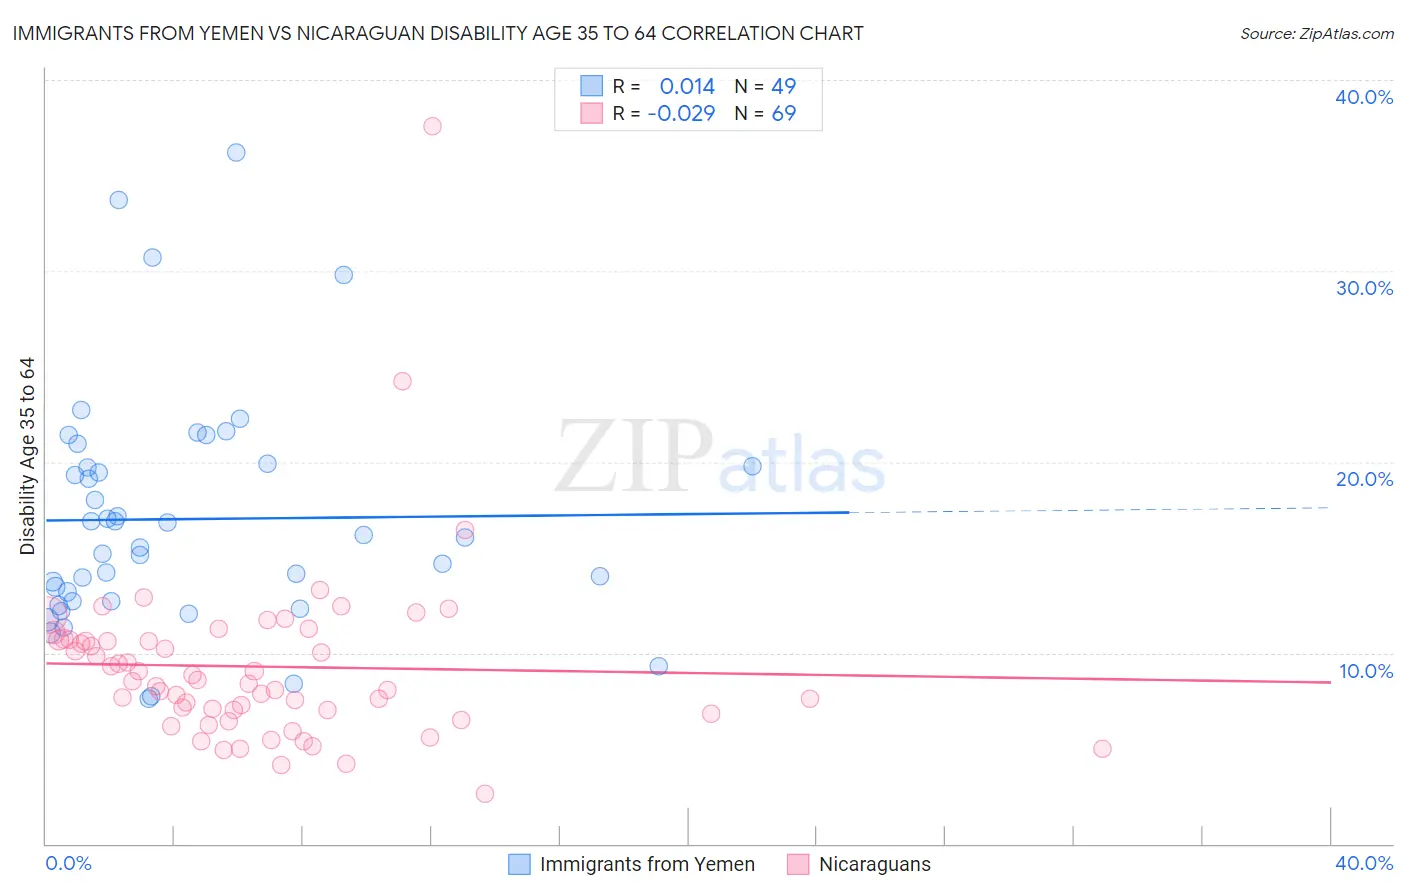
Immigrants from Yemen vs Nicaraguan Disability Age 35 to 64 Correlation Chart
The statistical analysis conducted on geographies consisting of 82,432,584 people shows no correlation between the proportion of Immigrants from Yemen and percentage of population with a disability between the ages 34 and 64 in the United States with a correlation coefficient (R) of 0.014 and weighted average of 14.0%. Similarly, the statistical analysis conducted on geographies consisting of 285,605,152 people shows no correlation between the proportion of Nicaraguans and percentage of population with a disability between the ages 34 and 64 in the United States with a correlation coefficient (R) of -0.029 and weighted average of 10.2%, a difference of 37.4%.
Disability Age 35 to 64 Correlation Summary
| Measurement | Immigrants from Yemen | Nicaraguan |
| Minimum | 7.6% | 2.6% |
| Maximum | 36.2% | 37.6% |
| Range | 28.6% | 35.0% |
| Mean | 17.0% | 9.3% |
| Median | 16.0% | 8.5% |
| Interquartile 25% (IQ1) | 12.7% | 6.9% |
| Interquartile 75% (IQ3) | 19.8% | 10.7% |
| Interquartile Range (IQR) | 7.1% | 3.8% |
| Standard Deviation (Sample) | 6.1% | 4.7% |
| Standard Deviation (Population) | 6.1% | 4.7% |
Similar Demographics by Disability Age 35 to 64
Demographics Similar to Immigrants from Yemen by Disability Age 35 to 64
In terms of disability age 35 to 64, the demographic groups most similar to Immigrants from Yemen are Blackfeet (14.1%, a difference of 0.16%), Inupiat (14.1%, a difference of 0.19%), Cree (14.1%, a difference of 0.26%), Cape Verdean (14.1%, a difference of 0.73%), and American (13.9%, a difference of 0.87%).
| Demographics | Rating | Rank | Disability Age 35 to 64 |
| Spanish Americans | 0.0 /100 | #299 | Tragic 13.7% |
| Delaware | 0.0 /100 | #300 | Tragic 13.7% |
| French American Indians | 0.0 /100 | #301 | Tragic 13.7% |
| Aleuts | 0.0 /100 | #302 | Tragic 13.8% |
| Sioux | 0.0 /100 | #303 | Tragic 13.9% |
| Hopi | 0.0 /100 | #304 | Tragic 13.9% |
| Americans | 0.0 /100 | #305 | Tragic 13.9% |
| Immigrants | Yemen | 0.0 /100 | #306 | Tragic 14.0% |
| Blackfeet | 0.0 /100 | #307 | Tragic 14.1% |
| Inupiat | 0.0 /100 | #308 | Tragic 14.1% |
| Cree | 0.0 /100 | #309 | Tragic 14.1% |
| Cape Verdeans | 0.0 /100 | #310 | Tragic 14.1% |
| Immigrants | Azores | 0.0 /100 | #311 | Tragic 14.3% |
| Paiute | 0.0 /100 | #312 | Tragic 14.3% |
| Iroquois | 0.0 /100 | #313 | Tragic 14.4% |
Demographics Similar to Nicaraguans by Disability Age 35 to 64
In terms of disability age 35 to 64, the demographic groups most similar to Nicaraguans are Immigrants from Europe (10.2%, a difference of 0.0%), Immigrants from Kuwait (10.2%, a difference of 0.080%), Chilean (10.2%, a difference of 0.23%), Uruguayan (10.2%, a difference of 0.25%), and Sri Lankan (10.2%, a difference of 0.29%).
| Demographics | Rating | Rank | Disability Age 35 to 64 |
| Immigrants | Croatia | 99.3 /100 | #80 | Exceptional 10.2% |
| Latvians | 99.2 /100 | #81 | Exceptional 10.2% |
| Russians | 99.2 /100 | #82 | Exceptional 10.2% |
| Immigrants | Brazil | 99.2 /100 | #83 | Exceptional 10.2% |
| Sri Lankans | 99.2 /100 | #84 | Exceptional 10.2% |
| Immigrants | Kuwait | 99.1 /100 | #85 | Exceptional 10.2% |
| Immigrants | Europe | 99.1 /100 | #86 | Exceptional 10.2% |
| Nicaraguans | 99.1 /100 | #87 | Exceptional 10.2% |
| Chileans | 99.0 /100 | #88 | Exceptional 10.2% |
| Uruguayans | 99.0 /100 | #89 | Exceptional 10.2% |
| Afghans | 98.9 /100 | #90 | Exceptional 10.3% |
| Immigrants | Lebanon | 98.9 /100 | #91 | Exceptional 10.3% |
| Immigrants | Northern Africa | 98.7 /100 | #92 | Exceptional 10.3% |
| Immigrants | North Macedonia | 98.7 /100 | #93 | Exceptional 10.3% |
| Immigrants | Italy | 98.7 /100 | #94 | Exceptional 10.3% |