Fijian vs Canadian Disability Age 18 to 34
COMPARE
Fijian
Canadian
Disability Age 18 to 34
Disability Age 18 to 34 Comparison
Fijians
Canadians
7.2%
DISABILITY AGE 18 TO 34
0.6/ 100
METRIC RATING
250th/ 347
METRIC RANK
7.3%
DISABILITY AGE 18 TO 34
0.2/ 100
METRIC RATING
262nd/ 347
METRIC RANK
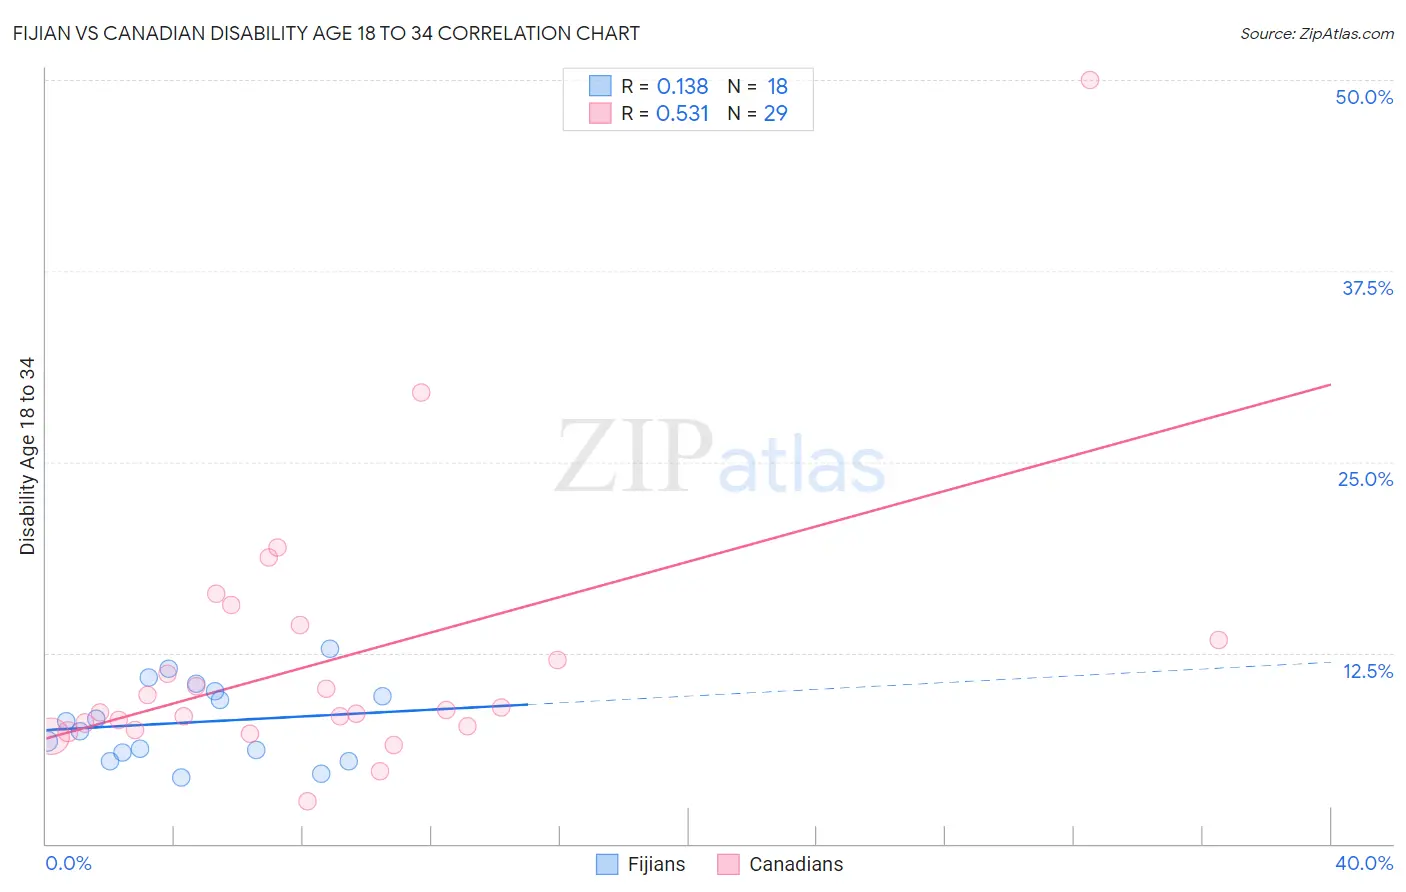
Fijian vs Canadian Disability Age 18 to 34 Correlation Chart
The statistical analysis conducted on geographies consisting of 55,913,538 people shows a poor positive correlation between the proportion of Fijians and percentage of population with a disability between the ages 18 and 35 in the United States with a correlation coefficient (R) of 0.138 and weighted average of 7.2%. Similarly, the statistical analysis conducted on geographies consisting of 436,030,339 people shows a substantial positive correlation between the proportion of Canadians and percentage of population with a disability between the ages 18 and 35 in the United States with a correlation coefficient (R) of 0.531 and weighted average of 7.3%, a difference of 1.7%.
Disability Age 18 to 34 Correlation Summary
| Measurement | Fijian | Canadian |
| Minimum | 4.3% | 2.8% |
| Maximum | 12.8% | 50.0% |
| Range | 8.5% | 47.2% |
| Mean | 7.9% | 12.0% |
| Median | 7.7% | 8.7% |
| Interquartile 25% (IQ1) | 6.0% | 7.6% |
| Interquartile 75% (IQ3) | 10.0% | 13.8% |
| Interquartile Range (IQR) | 4.0% | 6.3% |
| Standard Deviation (Sample) | 2.5% | 9.0% |
| Standard Deviation (Population) | 2.5% | 8.9% |
Demographics Similar to Fijians and Canadians by Disability Age 18 to 34
In terms of disability age 18 to 34, the demographic groups most similar to Fijians are Spaniard (7.2%, a difference of 0.010%), Polish (7.2%, a difference of 0.030%), Malaysian (7.2%, a difference of 0.29%), Croatian (7.2%, a difference of 0.30%), and Guamanian/Chamorro (7.2%, a difference of 0.39%). Similarly, the demographic groups most similar to Canadians are Northern European (7.3%, a difference of 0.030%), Tohono O'odham (7.3%, a difference of 0.20%), Somali (7.3%, a difference of 0.26%), British (7.3%, a difference of 0.29%), and Immigrants from Micronesia (7.3%, a difference of 0.33%).
| Demographics | Rating | Rank | Disability Age 18 to 34 |
| Immigrants | Liberia | 0.8 /100 | #246 | Tragic 7.1% |
| Yugoslavians | 0.8 /100 | #247 | Tragic 7.2% |
| Guamanians/Chamorros | 0.8 /100 | #248 | Tragic 7.2% |
| Malaysians | 0.7 /100 | #249 | Tragic 7.2% |
| Fijians | 0.6 /100 | #250 | Tragic 7.2% |
| Spaniards | 0.6 /100 | #251 | Tragic 7.2% |
| Poles | 0.6 /100 | #252 | Tragic 7.2% |
| Croatians | 0.5 /100 | #253 | Tragic 7.2% |
| Indonesians | 0.4 /100 | #254 | Tragic 7.2% |
| Immigrants | Germany | 0.4 /100 | #255 | Tragic 7.2% |
| Immigrants | Laos | 0.4 /100 | #256 | Tragic 7.2% |
| Czechs | 0.3 /100 | #257 | Tragic 7.2% |
| Immigrants | Micronesia | 0.3 /100 | #258 | Tragic 7.3% |
| Somalis | 0.2 /100 | #259 | Tragic 7.3% |
| Tohono O'odham | 0.2 /100 | #260 | Tragic 7.3% |
| Northern Europeans | 0.2 /100 | #261 | Tragic 7.3% |
| Canadians | 0.2 /100 | #262 | Tragic 7.3% |
| British | 0.2 /100 | #263 | Tragic 7.3% |
| Bermudans | 0.1 /100 | #264 | Tragic 7.3% |
| Slovenes | 0.1 /100 | #265 | Tragic 7.3% |
| German Russians | 0.1 /100 | #266 | Tragic 7.4% |