Soviet Union vs Ghanaian Cognitive Disability
COMPARE
Soviet Union
Ghanaian
Cognitive Disability
Cognitive Disability Comparison
Soviet Union
Ghanaians
16.5%
COGNITIVE DISABILITY
99.8/ 100
METRIC RATING
52nd/ 347
METRIC RANK
18.3%
COGNITIVE DISABILITY
0.0/ 100
METRIC RATING
299th/ 347
METRIC RANK
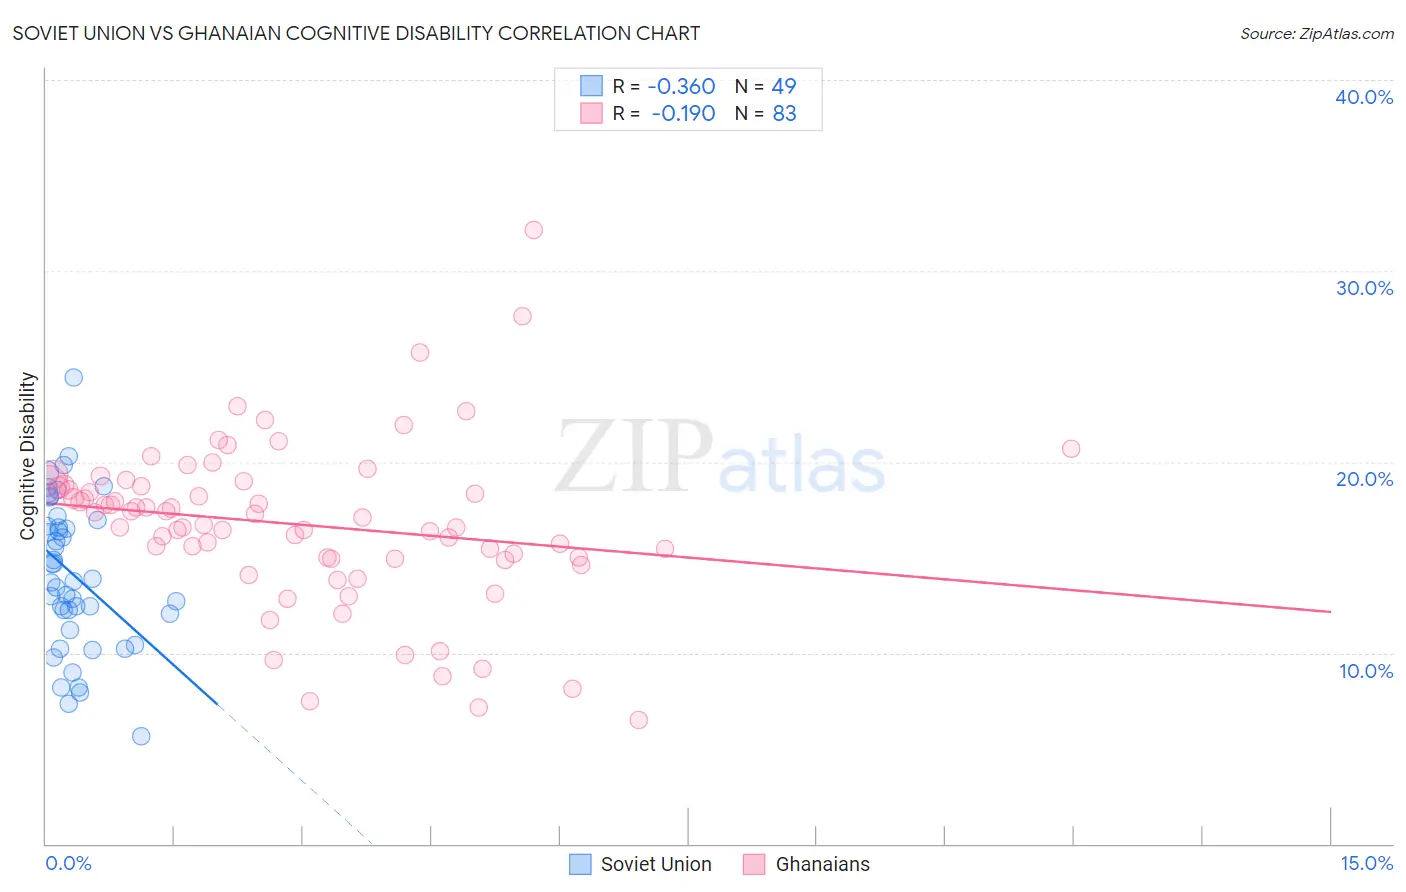
Soviet Union vs Ghanaian Cognitive Disability Correlation Chart
The statistical analysis conducted on geographies consisting of 43,504,324 people shows a mild negative correlation between the proportion of Soviet Union and percentage of population with cognitive disability in the United States with a correlation coefficient (R) of -0.360 and weighted average of 16.5%. Similarly, the statistical analysis conducted on geographies consisting of 190,691,747 people shows a poor negative correlation between the proportion of Ghanaians and percentage of population with cognitive disability in the United States with a correlation coefficient (R) of -0.190 and weighted average of 18.3%, a difference of 10.6%.
Cognitive Disability Correlation Summary
| Measurement | Soviet Union | Ghanaian |
| Minimum | 5.6% | 6.5% |
| Maximum | 24.4% | 32.2% |
| Range | 18.8% | 25.7% |
| Mean | 14.1% | 16.7% |
| Median | 13.7% | 17.1% |
| Interquartile 25% (IQ1) | 11.6% | 15.0% |
| Interquartile 75% (IQ3) | 16.8% | 18.8% |
| Interquartile Range (IQR) | 5.2% | 3.8% |
| Standard Deviation (Sample) | 3.9% | 4.3% |
| Standard Deviation (Population) | 3.9% | 4.3% |
Similar Demographics by Cognitive Disability
Demographics Similar to Soviet Union by Cognitive Disability
In terms of cognitive disability, the demographic groups most similar to Soviet Union are Immigrants from Korea (16.5%, a difference of 0.040%), Swedish (16.5%, a difference of 0.060%), Iranian (16.5%, a difference of 0.090%), Norwegian (16.5%, a difference of 0.090%), and Immigrants from Iran (16.5%, a difference of 0.10%).
| Demographics | Rating | Rank | Cognitive Disability |
| Immigrants | Europe | 99.8 /100 | #45 | Exceptional 16.5% |
| Immigrants | Colombia | 99.8 /100 | #46 | Exceptional 16.5% |
| Immigrants | Italy | 99.8 /100 | #47 | Exceptional 16.5% |
| Immigrants | North America | 99.8 /100 | #48 | Exceptional 16.5% |
| Iranians | 99.8 /100 | #49 | Exceptional 16.5% |
| Norwegians | 99.8 /100 | #50 | Exceptional 16.5% |
| Immigrants | Korea | 99.8 /100 | #51 | Exceptional 16.5% |
| Soviet Union | 99.8 /100 | #52 | Exceptional 16.5% |
| Swedes | 99.8 /100 | #53 | Exceptional 16.5% |
| Immigrants | Iran | 99.8 /100 | #54 | Exceptional 16.5% |
| Immigrants | Venezuela | 99.7 /100 | #55 | Exceptional 16.5% |
| Austrians | 99.7 /100 | #56 | Exceptional 16.6% |
| Bhutanese | 99.7 /100 | #57 | Exceptional 16.6% |
| Pennsylvania Germans | 99.7 /100 | #58 | Exceptional 16.6% |
| Immigrants | Peru | 99.7 /100 | #59 | Exceptional 16.6% |
Demographics Similar to Ghanaians by Cognitive Disability
In terms of cognitive disability, the demographic groups most similar to Ghanaians are Creek (18.3%, a difference of 0.020%), Japanese (18.3%, a difference of 0.030%), Blackfeet (18.3%, a difference of 0.040%), Immigrants from Ghana (18.3%, a difference of 0.17%), and Immigrants from Burma/Myanmar (18.2%, a difference of 0.18%).
| Demographics | Rating | Rank | Cognitive Disability |
| Iroquois | 0.1 /100 | #292 | Tragic 18.2% |
| Central American Indians | 0.1 /100 | #293 | Tragic 18.2% |
| British West Indians | 0.1 /100 | #294 | Tragic 18.2% |
| German Russians | 0.0 /100 | #295 | Tragic 18.2% |
| Immigrants | Burma/Myanmar | 0.0 /100 | #296 | Tragic 18.2% |
| Blackfeet | 0.0 /100 | #297 | Tragic 18.3% |
| Japanese | 0.0 /100 | #298 | Tragic 18.3% |
| Ghanaians | 0.0 /100 | #299 | Tragic 18.3% |
| Creek | 0.0 /100 | #300 | Tragic 18.3% |
| Immigrants | Ghana | 0.0 /100 | #301 | Tragic 18.3% |
| Barbadians | 0.0 /100 | #302 | Tragic 18.3% |
| Immigrants | Kenya | 0.0 /100 | #303 | Tragic 18.3% |
| Immigrants | Eritrea | 0.0 /100 | #304 | Tragic 18.3% |
| Colville | 0.0 /100 | #305 | Tragic 18.3% |
| Seminole | 0.0 /100 | #306 | Tragic 18.3% |