South American Indian vs Immigrants from Ireland Cognitive Disability
COMPARE
South American Indian
Immigrants from Ireland
Cognitive Disability
Cognitive Disability Comparison
South American Indians
Immigrants from Ireland
17.5%
COGNITIVE DISABILITY
13.0/ 100
METRIC RATING
201st/ 347
METRIC RANK
16.1%
COGNITIVE DISABILITY
100.0/ 100
METRIC RATING
7th/ 347
METRIC RANK
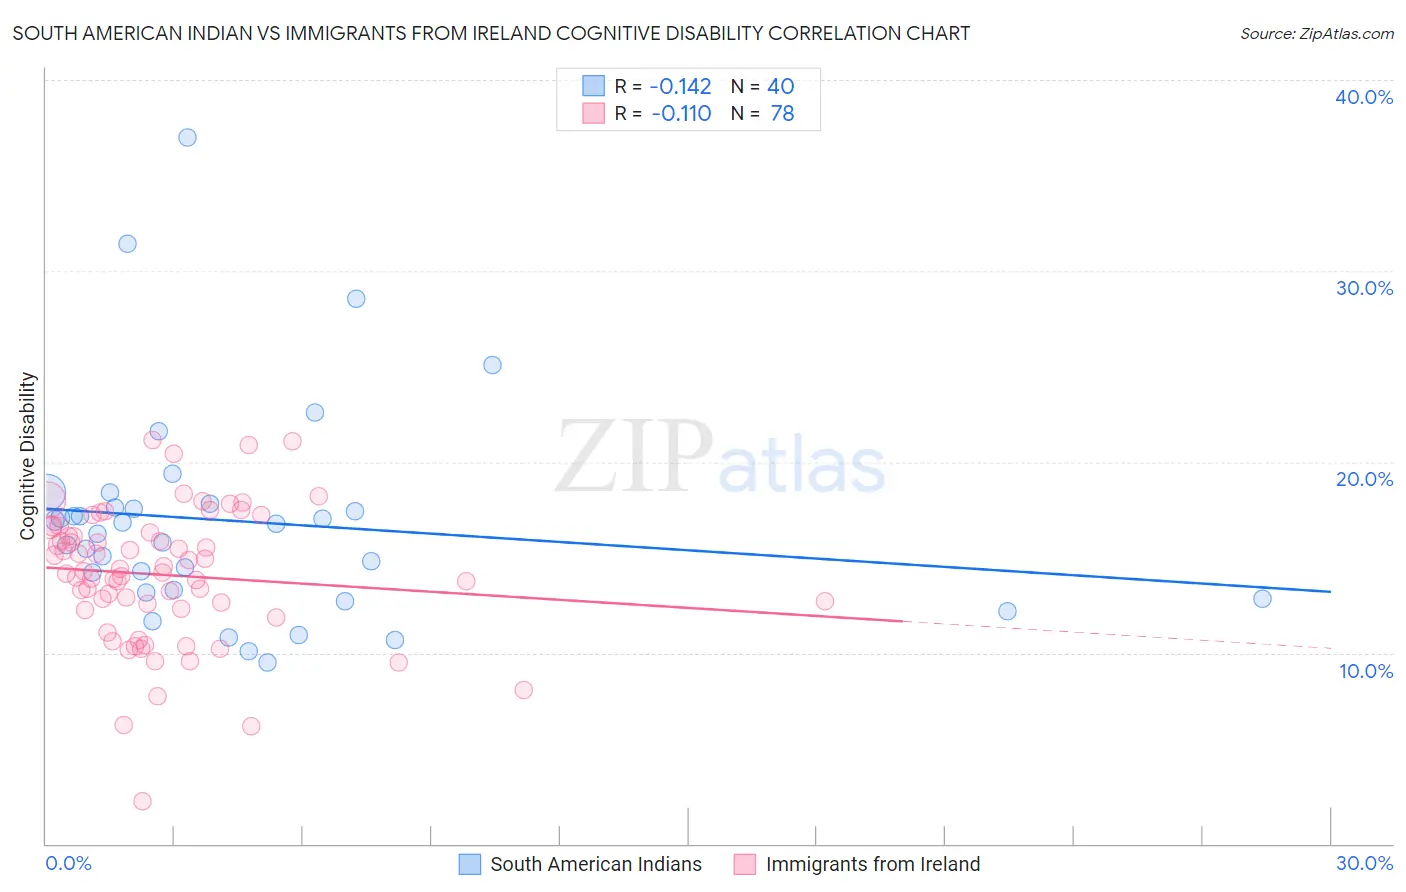
South American Indian vs Immigrants from Ireland Cognitive Disability Correlation Chart
The statistical analysis conducted on geographies consisting of 164,561,639 people shows a poor negative correlation between the proportion of South American Indians and percentage of population with cognitive disability in the United States with a correlation coefficient (R) of -0.142 and weighted average of 17.5%. Similarly, the statistical analysis conducted on geographies consisting of 240,767,768 people shows a poor negative correlation between the proportion of Immigrants from Ireland and percentage of population with cognitive disability in the United States with a correlation coefficient (R) of -0.110 and weighted average of 16.1%, a difference of 8.5%.
Cognitive Disability Correlation Summary
| Measurement | South American Indian | Immigrants from Ireland |
| Minimum | 9.5% | 2.2% |
| Maximum | 37.0% | 21.1% |
| Range | 27.5% | 18.9% |
| Mean | 16.9% | 14.1% |
| Median | 16.5% | 14.2% |
| Interquartile 25% (IQ1) | 13.3% | 12.3% |
| Interquartile 75% (IQ3) | 17.7% | 16.3% |
| Interquartile Range (IQR) | 4.5% | 4.0% |
| Standard Deviation (Sample) | 5.6% | 3.5% |
| Standard Deviation (Population) | 5.6% | 3.5% |
Similar Demographics by Cognitive Disability
Demographics Similar to South American Indians by Cognitive Disability
In terms of cognitive disability, the demographic groups most similar to South American Indians are Immigrants from Morocco (17.5%, a difference of 0.060%), Haitian (17.5%, a difference of 0.070%), Immigrants from Singapore (17.5%, a difference of 0.080%), Immigrants from Panama (17.5%, a difference of 0.11%), and Immigrants from Caribbean (17.5%, a difference of 0.13%).
| Demographics | Rating | Rank | Cognitive Disability |
| Immigrants | Bosnia and Herzegovina | 22.0 /100 | #194 | Fair 17.4% |
| New Zealanders | 21.1 /100 | #195 | Fair 17.4% |
| Guyanese | 17.5 /100 | #196 | Poor 17.5% |
| Immigrants | Afghanistan | 16.7 /100 | #197 | Poor 17.5% |
| Immigrants | Panama | 14.8 /100 | #198 | Poor 17.5% |
| Immigrants | Singapore | 14.3 /100 | #199 | Poor 17.5% |
| Haitians | 14.1 /100 | #200 | Poor 17.5% |
| South American Indians | 13.0 /100 | #201 | Poor 17.5% |
| Immigrants | Morocco | 12.0 /100 | #202 | Poor 17.5% |
| Immigrants | Caribbean | 11.0 /100 | #203 | Poor 17.5% |
| Immigrants | Zimbabwe | 11.0 /100 | #204 | Poor 17.5% |
| Puget Sound Salish | 10.9 /100 | #205 | Poor 17.5% |
| Alaska Natives | 10.4 /100 | #206 | Poor 17.5% |
| Immigrants | Latin America | 9.7 /100 | #207 | Tragic 17.6% |
| Immigrants | Cameroon | 9.3 /100 | #208 | Tragic 17.6% |
Demographics Similar to Immigrants from Ireland by Cognitive Disability
In terms of cognitive disability, the demographic groups most similar to Immigrants from Ireland are Immigrants from Poland (16.1%, a difference of 0.020%), Thai (16.1%, a difference of 0.11%), Assyrian/Chaldean/Syriac (16.2%, a difference of 0.34%), Immigrants from Scotland (16.2%, a difference of 0.38%), and Immigrants from Czechoslovakia (16.2%, a difference of 0.47%).
| Demographics | Rating | Rank | Cognitive Disability |
| Immigrants | Taiwan | 100.0 /100 | #1 | Exceptional 15.7% |
| Immigrants | India | 100.0 /100 | #2 | Exceptional 15.9% |
| Chinese | 100.0 /100 | #3 | Exceptional 15.9% |
| Immigrants | Lithuania | 100.0 /100 | #4 | Exceptional 16.0% |
| Immigrants | Hong Kong | 100.0 /100 | #5 | Exceptional 16.0% |
| Thais | 100.0 /100 | #6 | Exceptional 16.1% |
| Immigrants | Ireland | 100.0 /100 | #7 | Exceptional 16.1% |
| Immigrants | Poland | 100.0 /100 | #8 | Exceptional 16.1% |
| Assyrians/Chaldeans/Syriacs | 100.0 /100 | #9 | Exceptional 16.2% |
| Immigrants | Scotland | 100.0 /100 | #10 | Exceptional 16.2% |
| Immigrants | Czechoslovakia | 100.0 /100 | #11 | Exceptional 16.2% |
| Maltese | 100.0 /100 | #12 | Exceptional 16.2% |
| Lithuanians | 100.0 /100 | #13 | Exceptional 16.3% |
| Immigrants | Austria | 100.0 /100 | #14 | Exceptional 16.3% |
| Immigrants | Greece | 100.0 /100 | #15 | Exceptional 16.3% |