Slovene vs Belizean Disability Age 35 to 64
COMPARE
Slovene
Belizean
Disability Age 35 to 64
Disability Age 35 to 64 Comparison
Slovenes
Belizeans
11.4%
DISABILITY AGE 35 TO 64
36.6/ 100
METRIC RATING
186th/ 347
METRIC RANK
12.0%
DISABILITY AGE 35 TO 64
4.5/ 100
METRIC RATING
235th/ 347
METRIC RANK
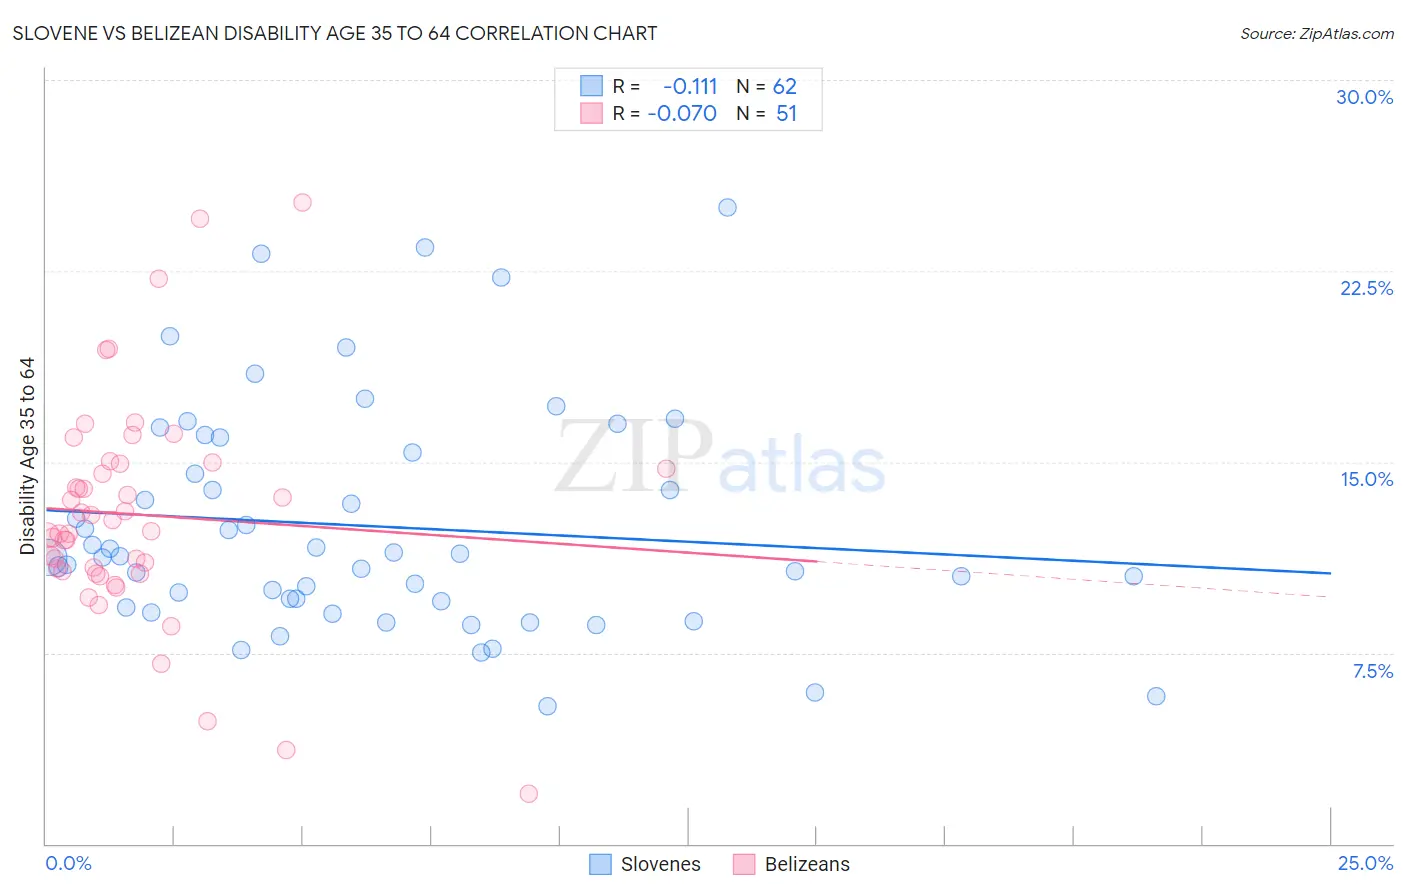
Slovene vs Belizean Disability Age 35 to 64 Correlation Chart
The statistical analysis conducted on geographies consisting of 261,217,453 people shows a poor negative correlation between the proportion of Slovenes and percentage of population with a disability between the ages 34 and 64 in the United States with a correlation coefficient (R) of -0.111 and weighted average of 11.4%. Similarly, the statistical analysis conducted on geographies consisting of 144,151,264 people shows a slight negative correlation between the proportion of Belizeans and percentage of population with a disability between the ages 34 and 64 in the United States with a correlation coefficient (R) of -0.070 and weighted average of 12.0%, a difference of 5.0%.
Disability Age 35 to 64 Correlation Summary
| Measurement | Slovene | Belizean |
| Minimum | 5.4% | 2.0% |
| Maximum | 25.0% | 25.2% |
| Range | 19.6% | 23.2% |
| Mean | 12.5% | 12.9% |
| Median | 11.3% | 12.3% |
| Interquartile 25% (IQ1) | 9.5% | 10.7% |
| Interquartile 75% (IQ3) | 15.4% | 14.9% |
| Interquartile Range (IQR) | 5.8% | 4.2% |
| Standard Deviation (Sample) | 4.4% | 4.3% |
| Standard Deviation (Population) | 4.4% | 4.3% |
Similar Demographics by Disability Age 35 to 64
Demographics Similar to Slovenes by Disability Age 35 to 64
In terms of disability age 35 to 64, the demographic groups most similar to Slovenes are Danish (11.4%, a difference of 0.010%), Immigrants from Bosnia and Herzegovina (11.4%, a difference of 0.13%), Northern European (11.4%, a difference of 0.15%), Hungarian (11.4%, a difference of 0.17%), and Kenyan (11.4%, a difference of 0.22%).
| Demographics | Rating | Rank | Disability Age 35 to 64 |
| Immigrants | Barbados | 41.6 /100 | #179 | Average 11.3% |
| Immigrants | Caribbean | 41.5 /100 | #180 | Average 11.3% |
| Trinidadians and Tobagonians | 40.8 /100 | #181 | Average 11.4% |
| Icelanders | 39.7 /100 | #182 | Fair 11.4% |
| Immigrants | Oceania | 39.5 /100 | #183 | Fair 11.4% |
| Kenyans | 39.2 /100 | #184 | Fair 11.4% |
| Danes | 36.8 /100 | #185 | Fair 11.4% |
| Slovenes | 36.6 /100 | #186 | Fair 11.4% |
| Immigrants | Bosnia and Herzegovina | 35.2 /100 | #187 | Fair 11.4% |
| Northern Europeans | 34.9 /100 | #188 | Fair 11.4% |
| Hungarians | 34.6 /100 | #189 | Fair 11.4% |
| Immigrants | Nigeria | 32.5 /100 | #190 | Fair 11.4% |
| Swedes | 31.3 /100 | #191 | Fair 11.4% |
| Norwegians | 29.7 /100 | #192 | Fair 11.5% |
| Immigrants | Africa | 29.0 /100 | #193 | Fair 11.5% |
Demographics Similar to Belizeans by Disability Age 35 to 64
In terms of disability age 35 to 64, the demographic groups most similar to Belizeans are Immigrants from Middle Africa (12.0%, a difference of 0.020%), Portuguese (11.9%, a difference of 0.13%), Bermudan (11.9%, a difference of 0.21%), Immigrants from Cambodia (12.0%, a difference of 0.28%), and Sudanese (11.9%, a difference of 0.31%).
| Demographics | Rating | Rank | Disability Age 35 to 64 |
| Immigrants | Germany | 6.2 /100 | #228 | Tragic 11.9% |
| British West Indians | 6.1 /100 | #229 | Tragic 11.9% |
| Panamanians | 5.8 /100 | #230 | Tragic 11.9% |
| Jamaicans | 5.7 /100 | #231 | Tragic 11.9% |
| Sudanese | 5.3 /100 | #232 | Tragic 11.9% |
| Bermudans | 5.0 /100 | #233 | Tragic 11.9% |
| Portuguese | 4.9 /100 | #234 | Tragic 11.9% |
| Belizeans | 4.5 /100 | #235 | Tragic 12.0% |
| Immigrants | Middle Africa | 4.5 /100 | #236 | Tragic 12.0% |
| Immigrants | Cambodia | 3.9 /100 | #237 | Tragic 12.0% |
| West Indians | 3.7 /100 | #238 | Tragic 12.0% |
| Immigrants | Western Africa | 3.3 /100 | #239 | Tragic 12.0% |
| Immigrants | Thailand | 3.3 /100 | #240 | Tragic 12.0% |
| Mexican American Indians | 3.2 /100 | #241 | Tragic 12.0% |
| Samoans | 2.8 /100 | #242 | Tragic 12.1% |