Slovene vs Danish Disability
COMPARE
Slovene
Danish
Disability
Disability Comparison
Slovenes
Danes
12.4%
DISABILITY
0.6/ 100
METRIC RATING
255th/ 347
METRIC RANK
12.0%
DISABILITY
8.7/ 100
METRIC RATING
209th/ 347
METRIC RANK
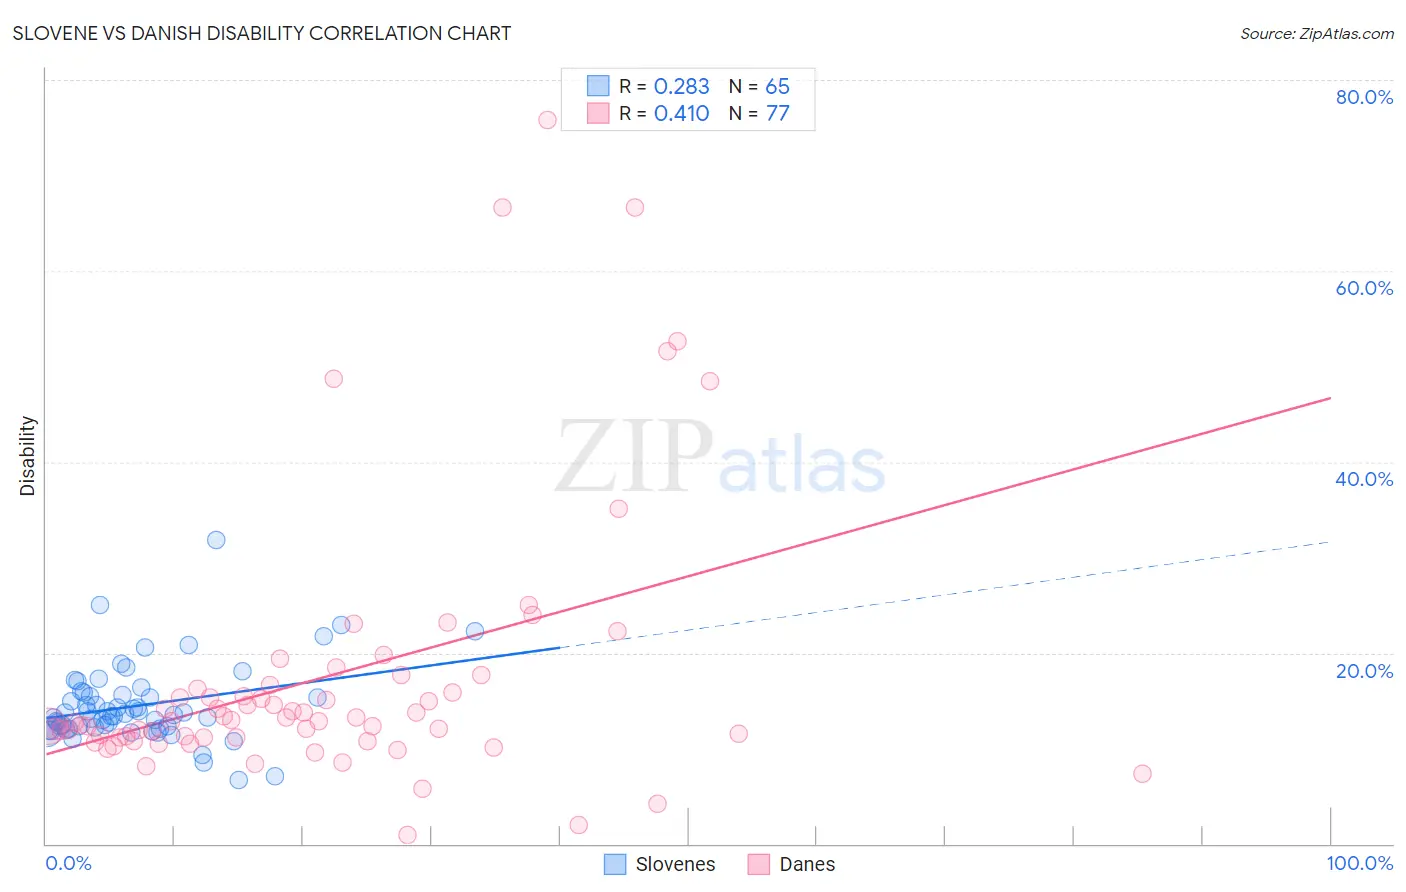
Slovene vs Danish Disability Correlation Chart
The statistical analysis conducted on geographies consisting of 261,350,851 people shows a weak positive correlation between the proportion of Slovenes and percentage of population with a disability in the United States with a correlation coefficient (R) of 0.283 and weighted average of 12.4%. Similarly, the statistical analysis conducted on geographies consisting of 474,128,503 people shows a moderate positive correlation between the proportion of Danes and percentage of population with a disability in the United States with a correlation coefficient (R) of 0.410 and weighted average of 12.0%, a difference of 3.0%.
Disability Correlation Summary
| Measurement | Slovene | Danish |
| Minimum | 6.7% | 0.97% |
| Maximum | 31.8% | 75.8% |
| Range | 25.1% | 74.8% |
| Mean | 14.5% | 17.5% |
| Median | 13.5% | 12.9% |
| Interquartile 25% (IQ1) | 12.1% | 11.1% |
| Interquartile 75% (IQ3) | 15.7% | 16.5% |
| Interquartile Range (IQR) | 3.6% | 5.4% |
| Standard Deviation (Sample) | 4.1% | 14.3% |
| Standard Deviation (Population) | 4.1% | 14.2% |
Similar Demographics by Disability
Demographics Similar to Slovenes by Disability
In terms of disability, the demographic groups most similar to Slovenes are Immigrants from Dominica (12.4%, a difference of 0.070%), Immigrants from Laos (12.4%, a difference of 0.16%), Slavic (12.4%, a difference of 0.30%), German Russian (12.3%, a difference of 0.33%), and Belgian (12.3%, a difference of 0.35%).
| Demographics | Rating | Rank | Disability |
| Guamanians/Chamorros | 1.4 /100 | #248 | Tragic 12.3% |
| Carpatho Rusyns | 1.4 /100 | #249 | Tragic 12.3% |
| Sub-Saharan Africans | 1.4 /100 | #250 | Tragic 12.3% |
| Europeans | 1.4 /100 | #251 | Tragic 12.3% |
| Bermudans | 1.1 /100 | #252 | Tragic 12.3% |
| Belgians | 0.8 /100 | #253 | Tragic 12.3% |
| German Russians | 0.8 /100 | #254 | Tragic 12.3% |
| Slovenes | 0.6 /100 | #255 | Tragic 12.4% |
| Immigrants | Dominica | 0.6 /100 | #256 | Tragic 12.4% |
| Immigrants | Laos | 0.5 /100 | #257 | Tragic 12.4% |
| Slavs | 0.5 /100 | #258 | Tragic 12.4% |
| Canadians | 0.4 /100 | #259 | Tragic 12.4% |
| Immigrants | Liberia | 0.4 /100 | #260 | Tragic 12.4% |
| Scandinavians | 0.4 /100 | #261 | Tragic 12.4% |
| Native Hawaiians | 0.3 /100 | #262 | Tragic 12.5% |
Demographics Similar to Danes by Disability
In terms of disability, the demographic groups most similar to Danes are Immigrants from Caribbean (12.0%, a difference of 0.050%), Immigrants from Thailand (12.0%, a difference of 0.070%), Immigrants from Senegal (12.0%, a difference of 0.080%), Czech (12.0%, a difference of 0.13%), and Immigrants from Western Europe (12.0%, a difference of 0.17%).
| Demographics | Rating | Rank | Disability |
| Immigrants | England | 12.0 /100 | #202 | Poor 12.0% |
| British West Indians | 11.5 /100 | #203 | Poor 12.0% |
| Mexican American Indians | 11.4 /100 | #204 | Poor 12.0% |
| Immigrants | Western Europe | 10.1 /100 | #205 | Poor 12.0% |
| Immigrants | Senegal | 9.4 /100 | #206 | Tragic 12.0% |
| Immigrants | Thailand | 9.3 /100 | #207 | Tragic 12.0% |
| Immigrants | Caribbean | 9.1 /100 | #208 | Tragic 12.0% |
| Danes | 8.7 /100 | #209 | Tragic 12.0% |
| Czechs | 7.9 /100 | #210 | Tragic 12.0% |
| Immigrants | Cambodia | 7.3 /100 | #211 | Tragic 12.0% |
| Austrians | 7.2 /100 | #212 | Tragic 12.0% |
| Immigrants | Iraq | 7.1 /100 | #213 | Tragic 12.0% |
| Immigrants | Somalia | 6.8 /100 | #214 | Tragic 12.0% |
| Immigrants | Canada | 6.1 /100 | #215 | Tragic 12.1% |
| Panamanians | 5.4 /100 | #216 | Tragic 12.1% |