Slovak vs Immigrants from Kenya Disability Age Under 5
COMPARE
Slovak
Immigrants from Kenya
Disability Age Under 5
Disability Age Under 5 Comparison
Slovaks
Immigrants from Kenya
1.7%
DISABILITY AGE UNDER 5
0.0/ 100
METRIC RATING
319th/ 347
METRIC RANK
1.2%
DISABILITY AGE UNDER 5
48.6/ 100
METRIC RATING
176th/ 347
METRIC RANK
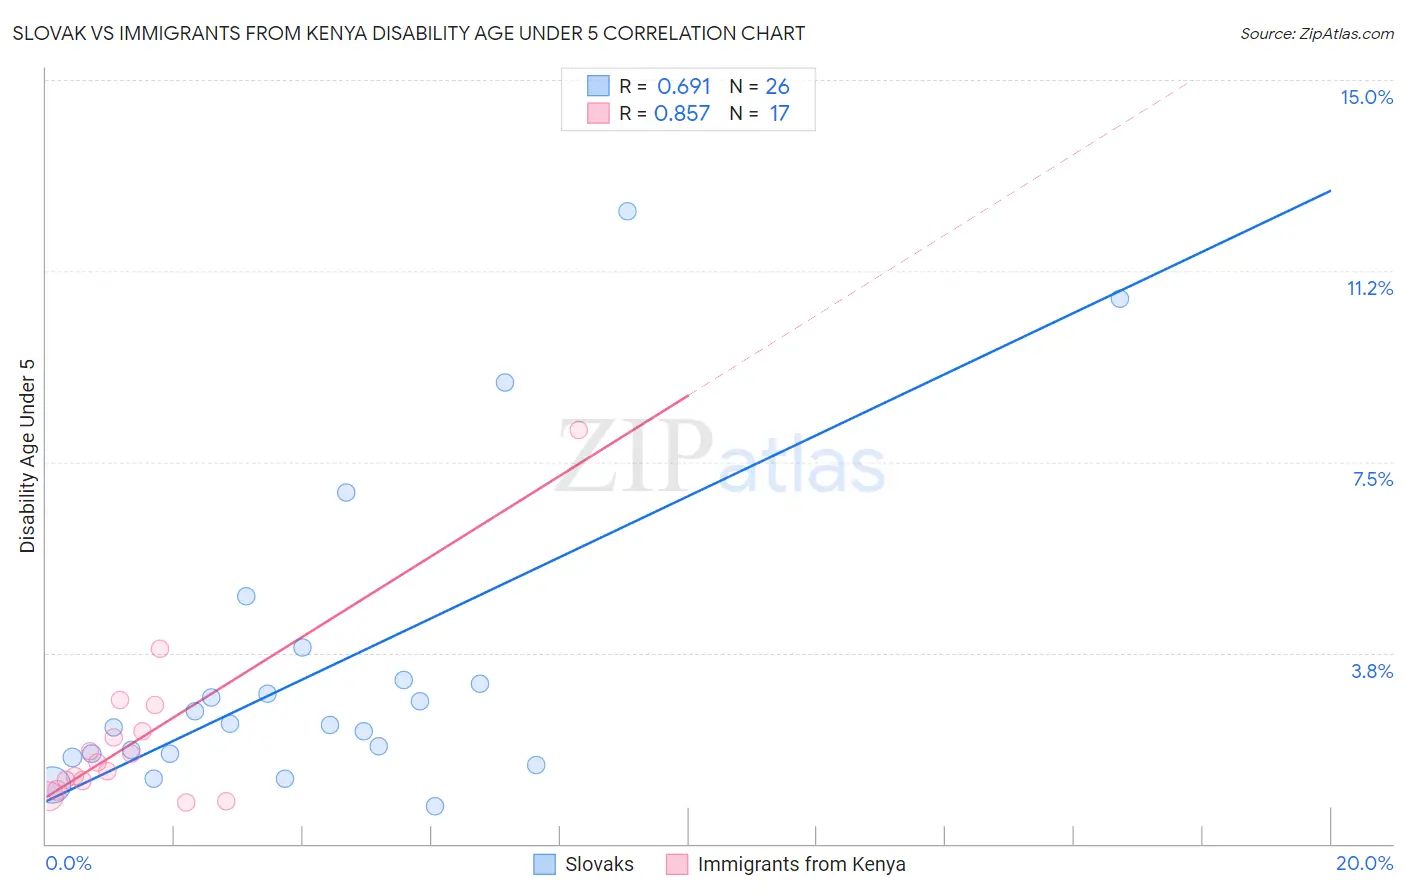
Slovak vs Immigrants from Kenya Disability Age Under 5 Correlation Chart
The statistical analysis conducted on geographies consisting of 205,574,578 people shows a significant positive correlation between the proportion of Slovaks and percentage of population with a disability under the age of 5 in the United States with a correlation coefficient (R) of 0.691 and weighted average of 1.7%. Similarly, the statistical analysis conducted on geographies consisting of 142,514,351 people shows a very strong positive correlation between the proportion of Immigrants from Kenya and percentage of population with a disability under the age of 5 in the United States with a correlation coefficient (R) of 0.857 and weighted average of 1.2%, a difference of 37.0%.
Disability Age Under 5 Correlation Summary
| Measurement | Slovak | Immigrants from Kenya |
| Minimum | 0.73% | 0.82% |
| Maximum | 12.4% | 8.1% |
| Range | 11.7% | 7.3% |
| Mean | 3.4% | 2.1% |
| Median | 2.3% | 1.6% |
| Interquartile 25% (IQ1) | 1.8% | 1.1% |
| Interquartile 75% (IQ3) | 3.2% | 2.5% |
| Interquartile Range (IQR) | 1.4% | 1.3% |
| Standard Deviation (Sample) | 3.0% | 1.7% |
| Standard Deviation (Population) | 2.9% | 1.7% |
Similar Demographics by Disability Age Under 5
Demographics Similar to Slovaks by Disability Age Under 5
In terms of disability age under 5, the demographic groups most similar to Slovaks are Irish (1.7%, a difference of 0.31%), Scotch-Irish (1.7%, a difference of 0.53%), French (1.7%, a difference of 0.58%), Ottawa (1.7%, a difference of 0.59%), and Immigrants from Cabo Verde (1.7%, a difference of 1.0%).
| Demographics | Rating | Rank | Disability Age Under 5 |
| Puerto Ricans | 0.0 /100 | #312 | Tragic 1.7% |
| Celtics | 0.0 /100 | #313 | Tragic 1.7% |
| Norwegians | 0.0 /100 | #314 | Tragic 1.7% |
| Dutch | 0.0 /100 | #315 | Tragic 1.7% |
| Immigrants | Cabo Verde | 0.0 /100 | #316 | Tragic 1.7% |
| French | 0.0 /100 | #317 | Tragic 1.7% |
| Irish | 0.0 /100 | #318 | Tragic 1.7% |
| Slovaks | 0.0 /100 | #319 | Tragic 1.7% |
| Scotch-Irish | 0.0 /100 | #320 | Tragic 1.7% |
| Ottawa | 0.0 /100 | #321 | Tragic 1.7% |
| Germans | 0.0 /100 | #322 | Tragic 1.7% |
| Chickasaw | 0.0 /100 | #323 | Tragic 1.7% |
| Cherokee | 0.0 /100 | #324 | Tragic 1.8% |
| Immigrants | Portugal | 0.0 /100 | #325 | Tragic 1.8% |
| Sioux | 0.0 /100 | #326 | Tragic 1.8% |
Demographics Similar to Immigrants from Kenya by Disability Age Under 5
In terms of disability age under 5, the demographic groups most similar to Immigrants from Kenya are Comanche (1.2%, a difference of 0.090%), Immigrants from Latvia (1.2%, a difference of 0.13%), Immigrants from Nigeria (1.2%, a difference of 0.13%), Venezuelan (1.2%, a difference of 0.14%), and Immigrants from Ireland (1.2%, a difference of 0.15%).
| Demographics | Rating | Rank | Disability Age Under 5 |
| Immigrants | Uruguay | 59.0 /100 | #169 | Average 1.2% |
| Immigrants | Jamaica | 58.8 /100 | #170 | Average 1.2% |
| Guamanians/Chamorros | 57.8 /100 | #171 | Average 1.2% |
| Crow | 51.0 /100 | #172 | Average 1.2% |
| Immigrants | Ireland | 50.3 /100 | #173 | Average 1.2% |
| Immigrants | Latvia | 50.0 /100 | #174 | Average 1.2% |
| Immigrants | Nigeria | 50.0 /100 | #175 | Average 1.2% |
| Immigrants | Kenya | 48.6 /100 | #176 | Average 1.2% |
| Comanche | 47.5 /100 | #177 | Average 1.2% |
| Venezuelans | 47.1 /100 | #178 | Average 1.2% |
| Immigrants | Bahamas | 45.2 /100 | #179 | Average 1.2% |
| Immigrants | Mexico | 44.4 /100 | #180 | Average 1.2% |
| Immigrants | Peru | 43.7 /100 | #181 | Average 1.2% |
| Macedonians | 43.7 /100 | #181 | Average 1.2% |
| Immigrants | Saudi Arabia | 43.3 /100 | #183 | Average 1.2% |