Sierra Leonean vs Austrian Male Disability
COMPARE
Sierra Leonean
Austrian
Male Disability
Male Disability Comparison
Sierra Leoneans
Austrians
10.5%
MALE DISABILITY
98.7/ 100
METRIC RATING
75th/ 347
METRIC RANK
11.8%
MALE DISABILITY
2.5/ 100
METRIC RATING
227th/ 347
METRIC RANK
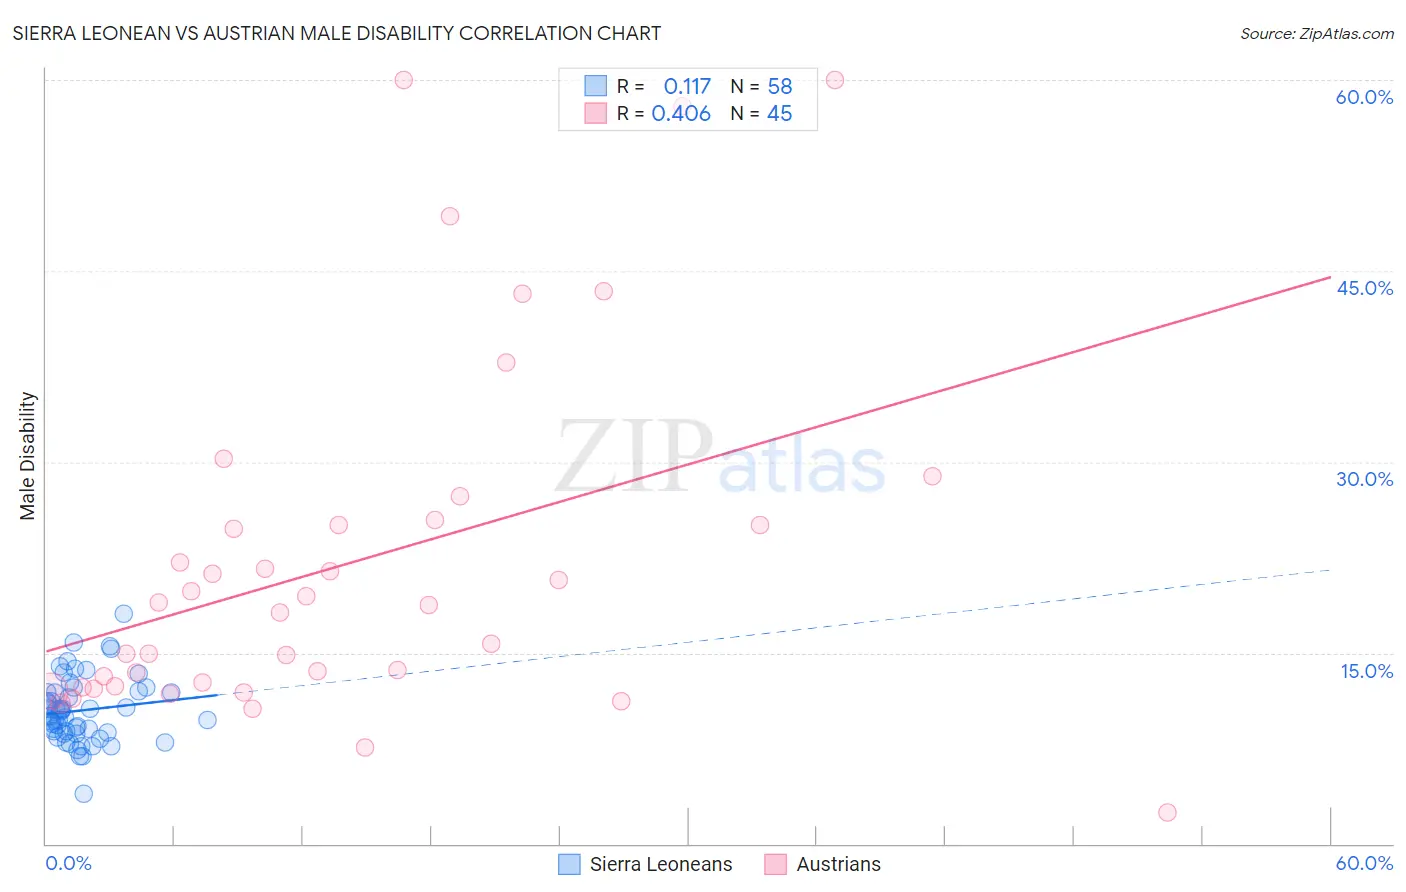
Sierra Leonean vs Austrian Male Disability Correlation Chart
The statistical analysis conducted on geographies consisting of 83,361,010 people shows a poor positive correlation between the proportion of Sierra Leoneans and percentage of males with a disability in the United States with a correlation coefficient (R) of 0.117 and weighted average of 10.5%. Similarly, the statistical analysis conducted on geographies consisting of 452,033,599 people shows a moderate positive correlation between the proportion of Austrians and percentage of males with a disability in the United States with a correlation coefficient (R) of 0.406 and weighted average of 11.8%, a difference of 11.8%.
Male Disability Correlation Summary
| Measurement | Sierra Leonean | Austrian |
| Minimum | 3.9% | 2.5% |
| Maximum | 18.1% | 60.0% |
| Range | 14.2% | 57.5% |
| Mean | 10.5% | 22.1% |
| Median | 10.2% | 18.8% |
| Interquartile 25% (IQ1) | 8.8% | 12.3% |
| Interquartile 75% (IQ3) | 11.9% | 25.2% |
| Interquartile Range (IQR) | 3.2% | 12.9% |
| Standard Deviation (Sample) | 2.6% | 13.9% |
| Standard Deviation (Population) | 2.6% | 13.8% |
Similar Demographics by Male Disability
Demographics Similar to Sierra Leoneans by Male Disability
In terms of male disability, the demographic groups most similar to Sierra Leoneans are Immigrants from Sierra Leone (10.5%, a difference of 0.040%), Laotian (10.6%, a difference of 0.10%), Immigrants from Lebanon (10.5%, a difference of 0.12%), Immigrants from Russia (10.6%, a difference of 0.12%), and Immigrants from Lithuania (10.5%, a difference of 0.26%).
| Demographics | Rating | Rank | Male Disability |
| Colombians | 99.2 /100 | #68 | Exceptional 10.5% |
| Ecuadorians | 99.2 /100 | #69 | Exceptional 10.5% |
| Immigrants | Bulgaria | 99.1 /100 | #70 | Exceptional 10.5% |
| Immigrants | Cameroon | 99.0 /100 | #71 | Exceptional 10.5% |
| Immigrants | Serbia | 99.0 /100 | #72 | Exceptional 10.5% |
| Immigrants | Lithuania | 98.9 /100 | #73 | Exceptional 10.5% |
| Immigrants | Lebanon | 98.8 /100 | #74 | Exceptional 10.5% |
| Sierra Leoneans | 98.7 /100 | #75 | Exceptional 10.5% |
| Immigrants | Sierra Leone | 98.7 /100 | #76 | Exceptional 10.5% |
| Laotians | 98.6 /100 | #77 | Exceptional 10.6% |
| Immigrants | Russia | 98.6 /100 | #78 | Exceptional 10.6% |
| Zimbabweans | 98.4 /100 | #79 | Exceptional 10.6% |
| Immigrants | Jordan | 98.4 /100 | #80 | Exceptional 10.6% |
| Immigrants | Chile | 98.3 /100 | #81 | Exceptional 10.6% |
| Immigrants | Guyana | 98.2 /100 | #82 | Exceptional 10.6% |
Demographics Similar to Austrians by Male Disability
In terms of male disability, the demographic groups most similar to Austrians are Hispanic or Latino (11.8%, a difference of 0.080%), Bermudan (11.8%, a difference of 0.11%), Subsaharan African (11.8%, a difference of 0.18%), Croatian (11.8%, a difference of 0.20%), and Liberian (11.8%, a difference of 0.30%).
| Demographics | Rating | Rank | Male Disability |
| Immigrants | Western Europe | 3.8 /100 | #220 | Tragic 11.7% |
| Immigrants | Congo | 3.7 /100 | #221 | Tragic 11.7% |
| Alsatians | 3.3 /100 | #222 | Tragic 11.7% |
| Immigrants | Bahamas | 3.2 /100 | #223 | Tragic 11.7% |
| Japanese | 3.1 /100 | #224 | Tragic 11.7% |
| Liberians | 3.1 /100 | #225 | Tragic 11.8% |
| Sub-Saharan Africans | 2.8 /100 | #226 | Tragic 11.8% |
| Austrians | 2.5 /100 | #227 | Tragic 11.8% |
| Hispanics or Latinos | 2.3 /100 | #228 | Tragic 11.8% |
| Bermudans | 2.3 /100 | #229 | Tragic 11.8% |
| Croatians | 2.1 /100 | #230 | Tragic 11.8% |
| Dominicans | 1.8 /100 | #231 | Tragic 11.8% |
| Malaysians | 1.8 /100 | #232 | Tragic 11.8% |
| Mexicans | 1.7 /100 | #233 | Tragic 11.8% |
| Immigrants | Canada | 1.6 /100 | #234 | Tragic 11.9% |