Samoan vs Tohono O'odham Cognitive Disability
COMPARE
Samoan
Tohono O'odham
Cognitive Disability
Cognitive Disability Comparison
Samoans
Tohono O'odham
17.9%
COGNITIVE DISABILITY
0.7/ 100
METRIC RATING
247th/ 347
METRIC RANK
19.3%
COGNITIVE DISABILITY
0.0/ 100
METRIC RATING
341st/ 347
METRIC RANK
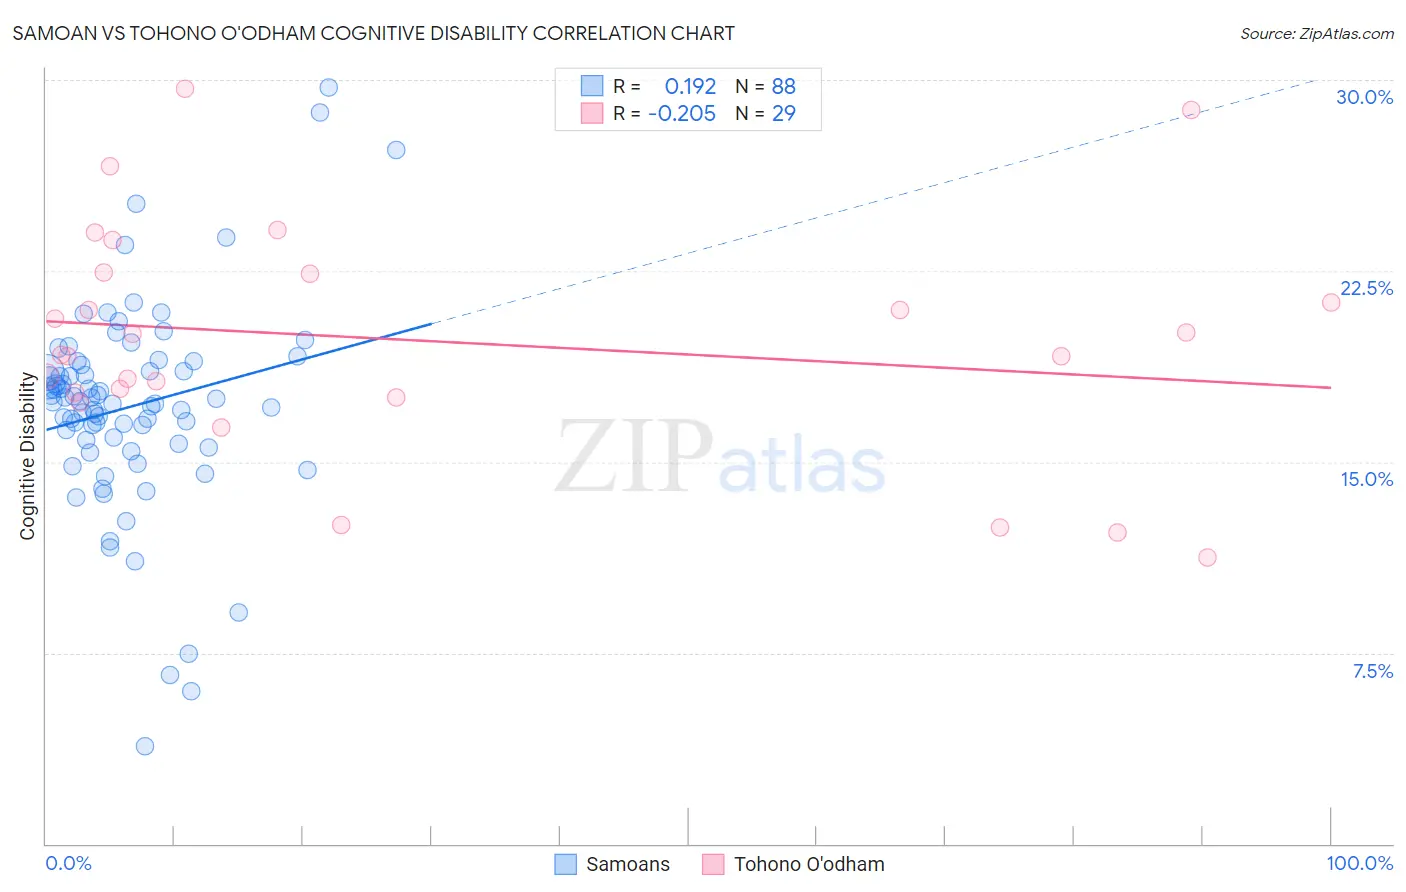
Samoan vs Tohono O'odham Cognitive Disability Correlation Chart
The statistical analysis conducted on geographies consisting of 225,130,180 people shows a poor positive correlation between the proportion of Samoans and percentage of population with cognitive disability in the United States with a correlation coefficient (R) of 0.192 and weighted average of 17.9%. Similarly, the statistical analysis conducted on geographies consisting of 58,725,044 people shows a weak negative correlation between the proportion of Tohono O'odham and percentage of population with cognitive disability in the United States with a correlation coefficient (R) of -0.205 and weighted average of 19.3%, a difference of 7.7%.
Cognitive Disability Correlation Summary
| Measurement | Samoan | Tohono O'odham |
| Minimum | 3.8% | 11.2% |
| Maximum | 29.7% | 29.7% |
| Range | 25.9% | 18.4% |
| Mean | 17.2% | 19.8% |
| Median | 17.4% | 19.2% |
| Interquartile 25% (IQ1) | 15.8% | 17.6% |
| Interquartile 75% (IQ3) | 18.7% | 22.4% |
| Interquartile Range (IQR) | 2.9% | 4.8% |
| Standard Deviation (Sample) | 4.1% | 4.5% |
| Standard Deviation (Population) | 4.1% | 4.4% |
Similar Demographics by Cognitive Disability
Demographics Similar to Samoans by Cognitive Disability
In terms of cognitive disability, the demographic groups most similar to Samoans are French American Indian (17.9%, a difference of 0.010%), Cree (17.9%, a difference of 0.060%), Immigrants from Ethiopia (17.9%, a difference of 0.060%), Immigrants from Thailand (17.9%, a difference of 0.070%), and Malaysian (17.9%, a difference of 0.070%).
| Demographics | Rating | Rank | Cognitive Disability |
| Iraqis | 1.4 /100 | #240 | Tragic 17.8% |
| Mexicans | 1.1 /100 | #241 | Tragic 17.8% |
| Paiute | 1.1 /100 | #242 | Tragic 17.8% |
| Immigrants | Bangladesh | 1.0 /100 | #243 | Tragic 17.8% |
| Jamaicans | 0.9 /100 | #244 | Tragic 17.9% |
| Trinidadians and Tobagonians | 0.8 /100 | #245 | Tragic 17.9% |
| Immigrants | Thailand | 0.8 /100 | #246 | Tragic 17.9% |
| Samoans | 0.7 /100 | #247 | Tragic 17.9% |
| French American Indians | 0.7 /100 | #248 | Tragic 17.9% |
| Cree | 0.7 /100 | #249 | Tragic 17.9% |
| Immigrants | Ethiopia | 0.7 /100 | #250 | Tragic 17.9% |
| Malaysians | 0.6 /100 | #251 | Tragic 17.9% |
| Immigrants | Grenada | 0.6 /100 | #252 | Tragic 17.9% |
| Hopi | 0.6 /100 | #253 | Tragic 17.9% |
| Hispanics or Latinos | 0.6 /100 | #254 | Tragic 17.9% |
Demographics Similar to Tohono O'odham by Cognitive Disability
In terms of cognitive disability, the demographic groups most similar to Tohono O'odham are Houma (19.3%, a difference of 0.0%), Cape Verdean (19.2%, a difference of 0.24%), Puerto Rican (19.2%, a difference of 0.26%), Immigrants from Zaire (19.4%, a difference of 0.69%), and Lumbee (19.1%, a difference of 0.74%).
| Demographics | Rating | Rank | Cognitive Disability |
| Immigrants | Yemen | 0.0 /100 | #333 | Tragic 18.8% |
| Sudanese | 0.0 /100 | #334 | Tragic 18.9% |
| Senegalese | 0.0 /100 | #335 | Tragic 19.0% |
| Blacks/African Americans | 0.0 /100 | #336 | Tragic 19.0% |
| Immigrants | Saudi Arabia | 0.0 /100 | #337 | Tragic 19.1% |
| Lumbee | 0.0 /100 | #338 | Tragic 19.1% |
| Puerto Ricans | 0.0 /100 | #339 | Tragic 19.2% |
| Cape Verdeans | 0.0 /100 | #340 | Tragic 19.2% |
| Tohono O'odham | 0.0 /100 | #341 | Tragic 19.3% |
| Houma | 0.0 /100 | #342 | Tragic 19.3% |
| Immigrants | Zaire | 0.0 /100 | #343 | Tragic 19.4% |
| Immigrants | Congo | 0.0 /100 | #344 | Tragic 19.7% |
| Somalis | 0.0 /100 | #345 | Tragic 19.8% |
| Immigrants | Cabo Verde | 0.0 /100 | #346 | Tragic 19.9% |
| Immigrants | Somalia | 0.0 /100 | #347 | Tragic 20.0% |