Costa Rican vs Immigrants from Asia Disability Age 65 to 74
COMPARE
Costa Rican
Immigrants from Asia
Disability Age 65 to 74
Disability Age 65 to 74 Comparison
Costa Ricans
Immigrants from Asia
22.6%
DISABILITY AGE 65 TO 74
89.2/ 100
METRIC RATING
132nd/ 347
METRIC RANK
21.5%
DISABILITY AGE 65 TO 74
99.5/ 100
METRIC RATING
57th/ 347
METRIC RANK
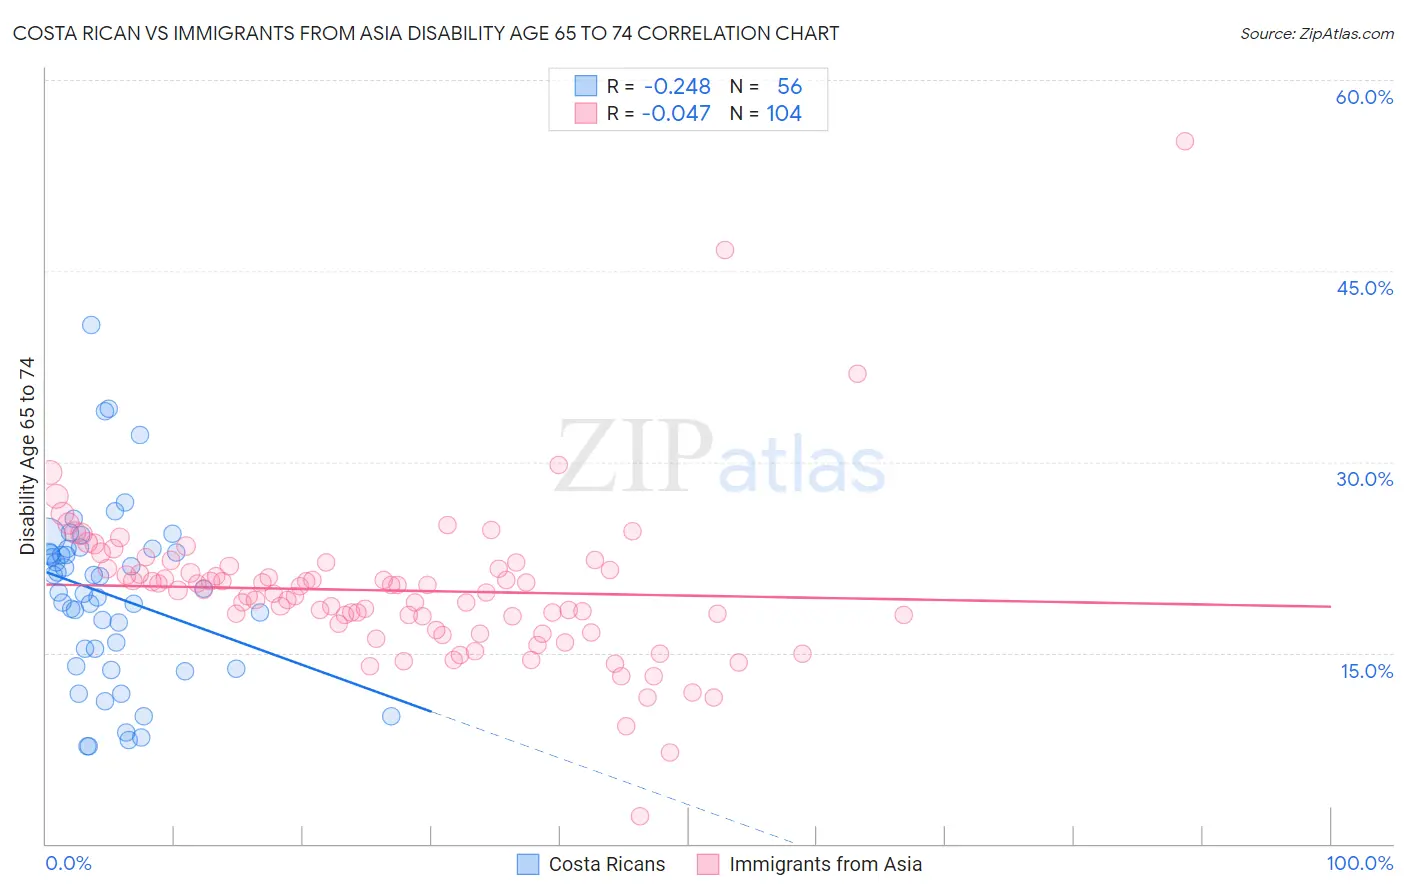
Costa Rican vs Immigrants from Asia Disability Age 65 to 74 Correlation Chart
The statistical analysis conducted on geographies consisting of 253,274,171 people shows a weak negative correlation between the proportion of Costa Ricans and percentage of population with a disability between the ages 65 and 75 in the United States with a correlation coefficient (R) of -0.248 and weighted average of 22.6%. Similarly, the statistical analysis conducted on geographies consisting of 547,092,389 people shows no correlation between the proportion of Immigrants from Asia and percentage of population with a disability between the ages 65 and 75 in the United States with a correlation coefficient (R) of -0.047 and weighted average of 21.5%, a difference of 5.0%.
Disability Age 65 to 74 Correlation Summary
| Measurement | Costa Rican | Immigrants from Asia |
| Minimum | 7.7% | 2.2% |
| Maximum | 40.7% | 55.2% |
| Range | 33.1% | 53.1% |
| Mean | 19.6% | 19.9% |
| Median | 19.9% | 19.8% |
| Interquartile 25% (IQ1) | 14.7% | 17.1% |
| Interquartile 75% (IQ3) | 23.0% | 21.6% |
| Interquartile Range (IQR) | 8.4% | 4.6% |
| Standard Deviation (Sample) | 6.9% | 6.3% |
| Standard Deviation (Population) | 6.8% | 6.3% |
Similar Demographics by Disability Age 65 to 74
Demographics Similar to Costa Ricans by Disability Age 65 to 74
In terms of disability age 65 to 74, the demographic groups most similar to Costa Ricans are Immigrants from Nepal (22.6%, a difference of 0.040%), Northern European (22.6%, a difference of 0.050%), Afghan (22.6%, a difference of 0.10%), Immigrants from Albania (22.6%, a difference of 0.13%), and Immigrants from Ukraine (22.6%, a difference of 0.13%).
| Demographics | Rating | Rank | Disability Age 65 to 74 |
| Immigrants | Western Europe | 92.3 /100 | #125 | Exceptional 22.5% |
| Lebanese | 92.2 /100 | #126 | Exceptional 22.5% |
| Slovaks | 91.6 /100 | #127 | Exceptional 22.5% |
| Immigrants | Costa Rica | 90.4 /100 | #128 | Exceptional 22.6% |
| Immigrants | Uruguay | 90.1 /100 | #129 | Exceptional 22.6% |
| Immigrants | Albania | 90.0 /100 | #130 | Excellent 22.6% |
| Immigrants | Nepal | 89.4 /100 | #131 | Excellent 22.6% |
| Costa Ricans | 89.2 /100 | #132 | Excellent 22.6% |
| Northern Europeans | 88.9 /100 | #133 | Excellent 22.6% |
| Afghans | 88.6 /100 | #134 | Excellent 22.6% |
| Immigrants | Ukraine | 88.4 /100 | #135 | Excellent 22.6% |
| Ethiopians | 87.9 /100 | #136 | Excellent 22.7% |
| Taiwanese | 87.6 /100 | #137 | Excellent 22.7% |
| Immigrants | Moldova | 87.3 /100 | #138 | Excellent 22.7% |
| Immigrants | Syria | 85.8 /100 | #139 | Excellent 22.7% |
Demographics Similar to Immigrants from Asia by Disability Age 65 to 74
In terms of disability age 65 to 74, the demographic groups most similar to Immigrants from Asia are Immigrants from Pakistan (21.5%, a difference of 0.030%), Zimbabwean (21.5%, a difference of 0.070%), Immigrants from Denmark (21.5%, a difference of 0.10%), Immigrants from North Macedonia (21.6%, a difference of 0.10%), and Immigrants from Romania (21.5%, a difference of 0.12%).
| Demographics | Rating | Rank | Disability Age 65 to 74 |
| Immigrants | Malaysia | 99.7 /100 | #50 | Exceptional 21.4% |
| Immigrants | Serbia | 99.6 /100 | #51 | Exceptional 21.4% |
| Immigrants | France | 99.6 /100 | #52 | Exceptional 21.5% |
| Bhutanese | 99.6 /100 | #53 | Exceptional 21.5% |
| Immigrants | Italy | 99.6 /100 | #54 | Exceptional 21.5% |
| Immigrants | Romania | 99.5 /100 | #55 | Exceptional 21.5% |
| Immigrants | Denmark | 99.5 /100 | #56 | Exceptional 21.5% |
| Immigrants | Asia | 99.5 /100 | #57 | Exceptional 21.5% |
| Immigrants | Pakistan | 99.5 /100 | #58 | Exceptional 21.5% |
| Zimbabweans | 99.5 /100 | #59 | Exceptional 21.5% |
| Immigrants | North Macedonia | 99.5 /100 | #60 | Exceptional 21.6% |
| Egyptians | 99.5 /100 | #61 | Exceptional 21.6% |
| Carpatho Rusyns | 99.5 /100 | #62 | Exceptional 21.6% |
| Immigrants | Europe | 99.4 /100 | #63 | Exceptional 21.6% |
| Immigrants | Latvia | 99.4 /100 | #64 | Exceptional 21.6% |