Immigrants from Japan vs Colville Vision Disability
COMPARE
Immigrants from Japan
Colville
Vision Disability
Vision Disability Comparison
Immigrants from Japan
Colville
1.9%
VISION DISABILITY
99.9/ 100
METRIC RATING
26th/ 347
METRIC RANK
3.0%
VISION DISABILITY
0.0/ 100
METRIC RATING
330th/ 347
METRIC RANK
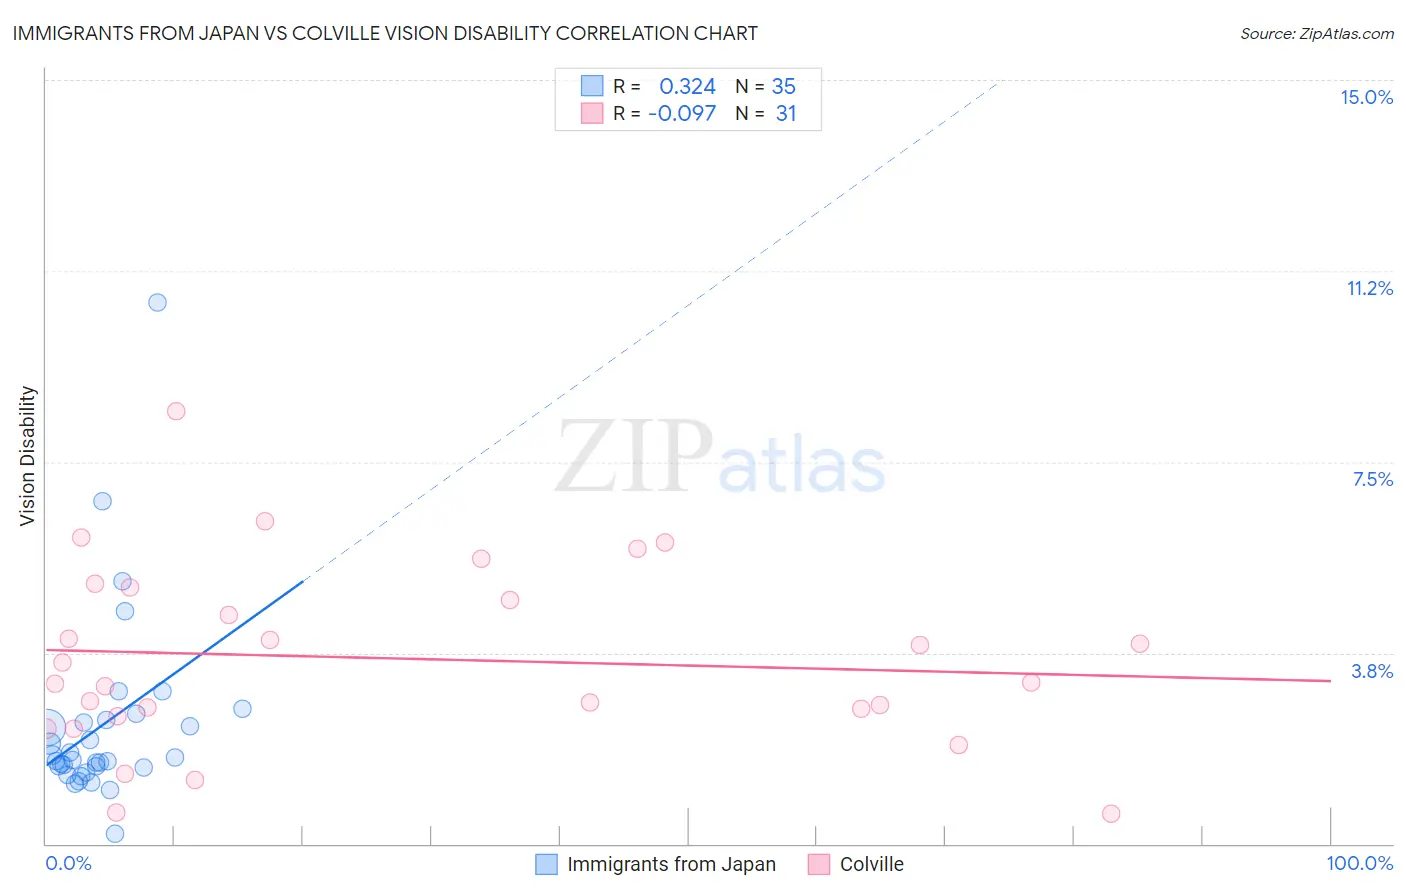
Immigrants from Japan vs Colville Vision Disability Correlation Chart
The statistical analysis conducted on geographies consisting of 339,950,646 people shows a mild positive correlation between the proportion of Immigrants from Japan and percentage of population with vision disability in the United States with a correlation coefficient (R) of 0.324 and weighted average of 1.9%. Similarly, the statistical analysis conducted on geographies consisting of 34,683,927 people shows a slight negative correlation between the proportion of Colville and percentage of population with vision disability in the United States with a correlation coefficient (R) of -0.097 and weighted average of 3.0%, a difference of 57.5%.
Vision Disability Correlation Summary
| Measurement | Immigrants from Japan | Colville |
| Minimum | 0.20% | 0.59% |
| Maximum | 10.6% | 8.5% |
| Range | 10.4% | 7.9% |
| Mean | 2.3% | 3.6% |
| Median | 1.6% | 3.2% |
| Interquartile 25% (IQ1) | 1.5% | 2.5% |
| Interquartile 75% (IQ3) | 2.4% | 5.0% |
| Interquartile Range (IQR) | 0.92% | 2.5% |
| Standard Deviation (Sample) | 1.9% | 1.8% |
| Standard Deviation (Population) | 1.9% | 1.8% |
Similar Demographics by Vision Disability
Demographics Similar to Immigrants from Japan by Vision Disability
In terms of vision disability, the demographic groups most similar to Immigrants from Japan are Bulgarian (1.9%, a difference of 0.040%), Immigrants from Lithuania (1.9%, a difference of 0.080%), Immigrants from Asia (1.9%, a difference of 0.20%), Taiwanese (1.9%, a difference of 0.34%), and Immigrants from Malaysia (1.9%, a difference of 0.36%).
| Demographics | Rating | Rank | Vision Disability |
| Immigrants | Sri Lanka | 100.0 /100 | #19 | Exceptional 1.9% |
| Asians | 100.0 /100 | #20 | Exceptional 1.9% |
| Turks | 100.0 /100 | #21 | Exceptional 1.9% |
| Immigrants | Pakistan | 100.0 /100 | #22 | Exceptional 1.9% |
| Immigrants | Asia | 99.9 /100 | #23 | Exceptional 1.9% |
| Immigrants | Lithuania | 99.9 /100 | #24 | Exceptional 1.9% |
| Bulgarians | 99.9 /100 | #25 | Exceptional 1.9% |
| Immigrants | Japan | 99.9 /100 | #26 | Exceptional 1.9% |
| Taiwanese | 99.9 /100 | #27 | Exceptional 1.9% |
| Immigrants | Malaysia | 99.9 /100 | #28 | Exceptional 1.9% |
| Egyptians | 99.9 /100 | #29 | Exceptional 1.9% |
| Immigrants | Nepal | 99.9 /100 | #30 | Exceptional 1.9% |
| Mongolians | 99.9 /100 | #31 | Exceptional 1.9% |
| Luxembourgers | 99.9 /100 | #32 | Exceptional 1.9% |
| Immigrants | Egypt | 99.9 /100 | #33 | Exceptional 1.9% |
Demographics Similar to Colville by Vision Disability
In terms of vision disability, the demographic groups most similar to Colville are Central American Indian (3.0%, a difference of 0.64%), Seminole (3.1%, a difference of 1.1%), Cajun (3.1%, a difference of 1.1%), Apache (3.0%, a difference of 1.2%), and Yuman (3.0%, a difference of 1.4%).
| Demographics | Rating | Rank | Vision Disability |
| Tlingit-Haida | 0.0 /100 | #323 | Tragic 2.9% |
| Hopi | 0.0 /100 | #324 | Tragic 2.9% |
| Cherokee | 0.0 /100 | #325 | Tragic 2.9% |
| Spanish Americans | 0.0 /100 | #326 | Tragic 2.9% |
| Natives/Alaskans | 0.0 /100 | #327 | Tragic 3.0% |
| Yuman | 0.0 /100 | #328 | Tragic 3.0% |
| Apache | 0.0 /100 | #329 | Tragic 3.0% |
| Colville | 0.0 /100 | #330 | Tragic 3.0% |
| Central American Indians | 0.0 /100 | #331 | Tragic 3.0% |
| Seminole | 0.0 /100 | #332 | Tragic 3.1% |
| Cajuns | 0.0 /100 | #333 | Tragic 3.1% |
| Cheyenne | 0.0 /100 | #334 | Tragic 3.1% |
| Navajo | 0.0 /100 | #335 | Tragic 3.1% |
| Alaskan Athabascans | 0.0 /100 | #336 | Tragic 3.1% |
| Dutch West Indians | 0.0 /100 | #337 | Tragic 3.2% |