Immigrants from Grenada vs Immigrants from West Indies Hearing Disability
COMPARE
Immigrants from Grenada
Immigrants from West Indies
Hearing Disability
Hearing Disability Comparison
Immigrants from Grenada
Immigrants from West Indies
2.2%
HEARING DISABILITY
100.0/ 100
METRIC RATING
1st/ 347
METRIC RANK
2.5%
HEARING DISABILITY
99.9/ 100
METRIC RATING
16th/ 347
METRIC RANK
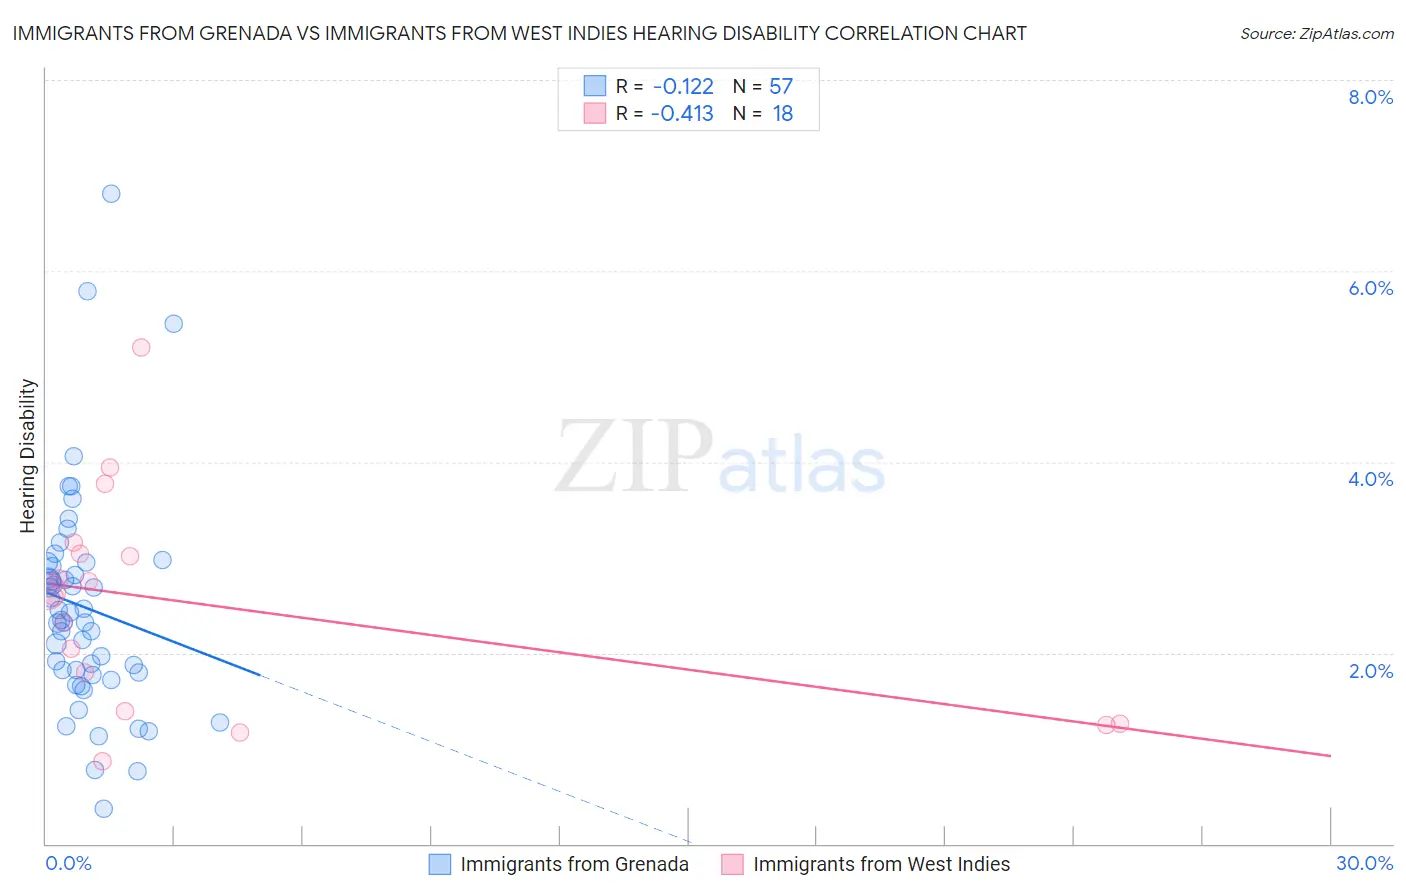
Immigrants from Grenada vs Immigrants from West Indies Hearing Disability Correlation Chart
The statistical analysis conducted on geographies consisting of 67,188,332 people shows a poor negative correlation between the proportion of Immigrants from Grenada and percentage of population with hearing disability in the United States with a correlation coefficient (R) of -0.122 and weighted average of 2.2%. Similarly, the statistical analysis conducted on geographies consisting of 72,456,124 people shows a moderate negative correlation between the proportion of Immigrants from West Indies and percentage of population with hearing disability in the United States with a correlation coefficient (R) of -0.413 and weighted average of 2.5%, a difference of 15.0%.
Hearing Disability Correlation Summary
| Measurement | Immigrants from Grenada | Immigrants from West Indies |
| Minimum | 0.37% | 0.87% |
| Maximum | 6.8% | 5.2% |
| Range | 6.4% | 4.3% |
| Mean | 2.5% | 2.5% |
| Median | 2.3% | 2.6% |
| Interquartile 25% (IQ1) | 1.8% | 1.4% |
| Interquartile 75% (IQ3) | 2.9% | 3.0% |
| Interquartile Range (IQR) | 1.1% | 1.6% |
| Standard Deviation (Sample) | 1.2% | 1.1% |
| Standard Deviation (Population) | 1.1% | 1.1% |
Demographics Similar to Immigrants from Grenada and Immigrants from West Indies by Hearing Disability
In terms of hearing disability, the demographic groups most similar to Immigrants from Grenada are Immigrants from St. Vincent and the Grenadines (2.3%, a difference of 2.9%), Guyanese (2.3%, a difference of 4.3%), Immigrants from Guyana (2.3%, a difference of 5.8%), Immigrants from Barbados (2.4%, a difference of 7.8%), and Vietnamese (2.4%, a difference of 8.9%). Similarly, the demographic groups most similar to Immigrants from West Indies are Barbadian (2.5%, a difference of 0.15%), Immigrants from India (2.5%, a difference of 0.32%), Ecuadorian (2.5%, a difference of 0.45%), Sierra Leonean (2.5%, a difference of 0.77%), and Trinidadian and Tobagonian (2.5%, a difference of 1.0%).
| Demographics | Rating | Rank | Hearing Disability |
| Immigrants | Grenada | 100.0 /100 | #1 | Exceptional 2.2% |
| Immigrants | St. Vincent and the Grenadines | 100.0 /100 | #2 | Exceptional 2.3% |
| Guyanese | 100.0 /100 | #3 | Exceptional 2.3% |
| Immigrants | Guyana | 100.0 /100 | #4 | Exceptional 2.3% |
| Immigrants | Barbados | 100.0 /100 | #5 | Exceptional 2.4% |
| Vietnamese | 100.0 /100 | #6 | Exceptional 2.4% |
| Immigrants | Bangladesh | 100.0 /100 | #7 | Exceptional 2.4% |
| British West Indians | 100.0 /100 | #8 | Exceptional 2.4% |
| Immigrants | Dominican Republic | 100.0 /100 | #9 | Exceptional 2.4% |
| Immigrants | Ecuador | 99.9 /100 | #10 | Exceptional 2.5% |
| Immigrants | Trinidad and Tobago | 99.9 /100 | #11 | Exceptional 2.5% |
| Trinidadians and Tobagonians | 99.9 /100 | #12 | Exceptional 2.5% |
| Sierra Leoneans | 99.9 /100 | #13 | Exceptional 2.5% |
| Ecuadorians | 99.9 /100 | #14 | Exceptional 2.5% |
| Barbadians | 99.9 /100 | #15 | Exceptional 2.5% |
| Immigrants | West Indies | 99.9 /100 | #16 | Exceptional 2.5% |
| Immigrants | India | 99.9 /100 | #17 | Exceptional 2.5% |
| Dominicans | 99.8 /100 | #18 | Exceptional 2.5% |
| Thais | 99.8 /100 | #19 | Exceptional 2.5% |
| Immigrants | Bolivia | 99.8 /100 | #20 | Exceptional 2.5% |