Paraguayan vs Nepalese Unemployment Among Seniors over 65 years
COMPARE
Paraguayan
Nepalese
Unemployment Among Seniors over 65 years
Unemployment Among Seniors over 65 years Comparison
Paraguayans
Nepalese
5.4%
UNEMPLOYMENT AMONG SENIORS OVER 65 YEARS
0.5/ 100
METRIC RATING
254th/ 347
METRIC RANK
5.1%
UNEMPLOYMENT AMONG SENIORS OVER 65 YEARS
64.5/ 100
METRIC RATING
164th/ 347
METRIC RANK
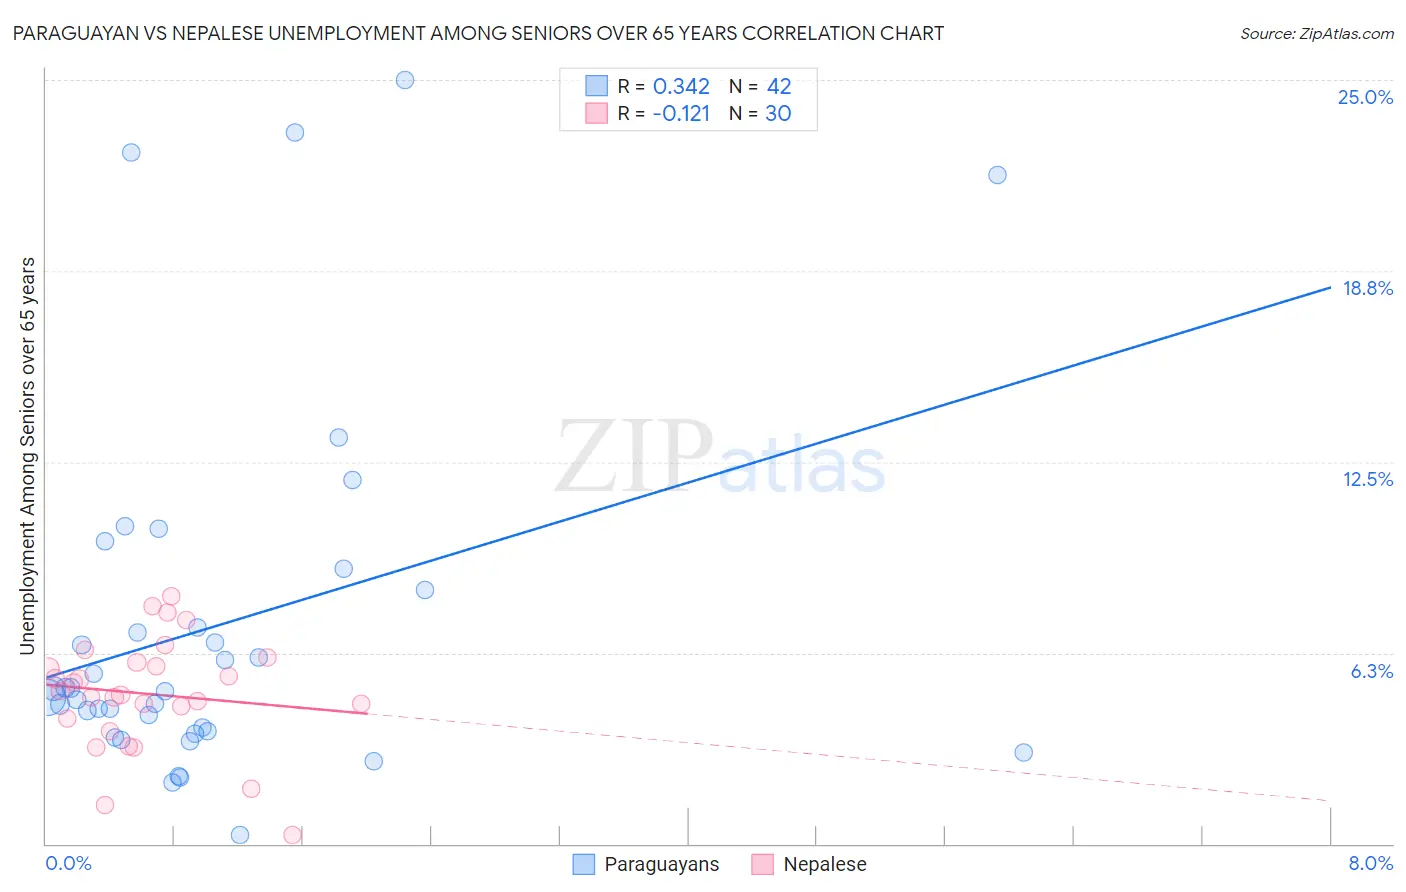
Paraguayan vs Nepalese Unemployment Among Seniors over 65 years Correlation Chart
The statistical analysis conducted on geographies consisting of 92,590,465 people shows a mild positive correlation between the proportion of Paraguayans and unemployment rate amomg seniors over the age of 65 in the United States with a correlation coefficient (R) of 0.342 and weighted average of 5.4%. Similarly, the statistical analysis conducted on geographies consisting of 24,020,943 people shows a poor negative correlation between the proportion of Nepalese and unemployment rate amomg seniors over the age of 65 in the United States with a correlation coefficient (R) of -0.121 and weighted average of 5.1%, a difference of 4.7%.
Unemployment Among Seniors over 65 years Correlation Summary
| Measurement | Paraguayan | Nepalese |
| Minimum | 0.30% | 0.30% |
| Maximum | 25.0% | 8.1% |
| Range | 24.7% | 7.8% |
| Mean | 7.2% | 4.9% |
| Median | 5.0% | 4.9% |
| Interquartile 25% (IQ1) | 3.7% | 4.1% |
| Interquartile 75% (IQ3) | 8.3% | 5.9% |
| Interquartile Range (IQR) | 4.6% | 1.8% |
| Standard Deviation (Sample) | 5.9% | 1.8% |
| Standard Deviation (Population) | 5.9% | 1.8% |
Similar Demographics by Unemployment Among Seniors over 65 years
Demographics Similar to Paraguayans by Unemployment Among Seniors over 65 years
In terms of unemployment among seniors over 65 years, the demographic groups most similar to Paraguayans are Immigrants from Peru (5.4%, a difference of 0.010%), Moroccan (5.4%, a difference of 0.030%), Immigrants from Sierra Leone (5.4%, a difference of 0.060%), Trinidadian and Tobagonian (5.4%, a difference of 0.090%), and Immigrants from Micronesia (5.4%, a difference of 0.12%).
| Demographics | Rating | Rank | Unemployment Among Seniors over 65 years |
| Immigrants | Caribbean | 0.7 /100 | #247 | Tragic 5.3% |
| French Canadians | 0.7 /100 | #248 | Tragic 5.4% |
| Immigrants | Immigrants | 0.6 /100 | #249 | Tragic 5.4% |
| Ghanaians | 0.6 /100 | #250 | Tragic 5.4% |
| West Indians | 0.6 /100 | #251 | Tragic 5.4% |
| Trinidadians and Tobagonians | 0.6 /100 | #252 | Tragic 5.4% |
| Immigrants | Sierra Leone | 0.6 /100 | #253 | Tragic 5.4% |
| Paraguayans | 0.5 /100 | #254 | Tragic 5.4% |
| Immigrants | Peru | 0.5 /100 | #255 | Tragic 5.4% |
| Moroccans | 0.5 /100 | #256 | Tragic 5.4% |
| Immigrants | Micronesia | 0.4 /100 | #257 | Tragic 5.4% |
| Sierra Leoneans | 0.4 /100 | #258 | Tragic 5.4% |
| Immigrants | Ghana | 0.4 /100 | #259 | Tragic 5.4% |
| Native Hawaiians | 0.3 /100 | #260 | Tragic 5.4% |
| Spanish American Indians | 0.2 /100 | #261 | Tragic 5.4% |
Demographics Similar to Nepalese by Unemployment Among Seniors over 65 years
In terms of unemployment among seniors over 65 years, the demographic groups most similar to Nepalese are Potawatomi (5.1%, a difference of 0.0%), Immigrants from Ukraine (5.1%, a difference of 0.010%), Immigrants from Laos (5.1%, a difference of 0.020%), Immigrants from South Eastern Asia (5.1%, a difference of 0.040%), and Immigrants from Bosnia and Herzegovina (5.1%, a difference of 0.060%).
| Demographics | Rating | Rank | Unemployment Among Seniors over 65 years |
| Immigrants | Northern Europe | 69.8 /100 | #157 | Good 5.1% |
| Immigrants | Belarus | 69.0 /100 | #158 | Good 5.1% |
| Immigrants | France | 68.6 /100 | #159 | Good 5.1% |
| French | 68.1 /100 | #160 | Good 5.1% |
| Immigrants | Bosnia and Herzegovina | 66.1 /100 | #161 | Good 5.1% |
| Immigrants | South Eastern Asia | 65.6 /100 | #162 | Good 5.1% |
| Potawatomi | 64.5 /100 | #163 | Good 5.1% |
| Nepalese | 64.5 /100 | #164 | Good 5.1% |
| Immigrants | Ukraine | 64.2 /100 | #165 | Good 5.1% |
| Immigrants | Laos | 63.8 /100 | #166 | Good 5.1% |
| Immigrants | Western Europe | 60.4 /100 | #167 | Good 5.1% |
| Mongolians | 59.8 /100 | #168 | Average 5.1% |
| Lithuanians | 58.2 /100 | #169 | Average 5.1% |
| Immigrants | Eastern Asia | 54.9 /100 | #170 | Average 5.1% |
| Immigrants | Nonimmigrants | 54.1 /100 | #171 | Average 5.1% |