Panamanian vs Immigrants from Zaire Disability Age 18 to 34
COMPARE
Panamanian
Immigrants from Zaire
Disability Age 18 to 34
Disability Age 18 to 34 Comparison
Panamanians
Immigrants from Zaire
6.8%
DISABILITY AGE 18 TO 34
15.8/ 100
METRIC RATING
202nd/ 347
METRIC RANK
7.1%
DISABILITY AGE 18 TO 34
0.9/ 100
METRIC RATING
244th/ 347
METRIC RANK
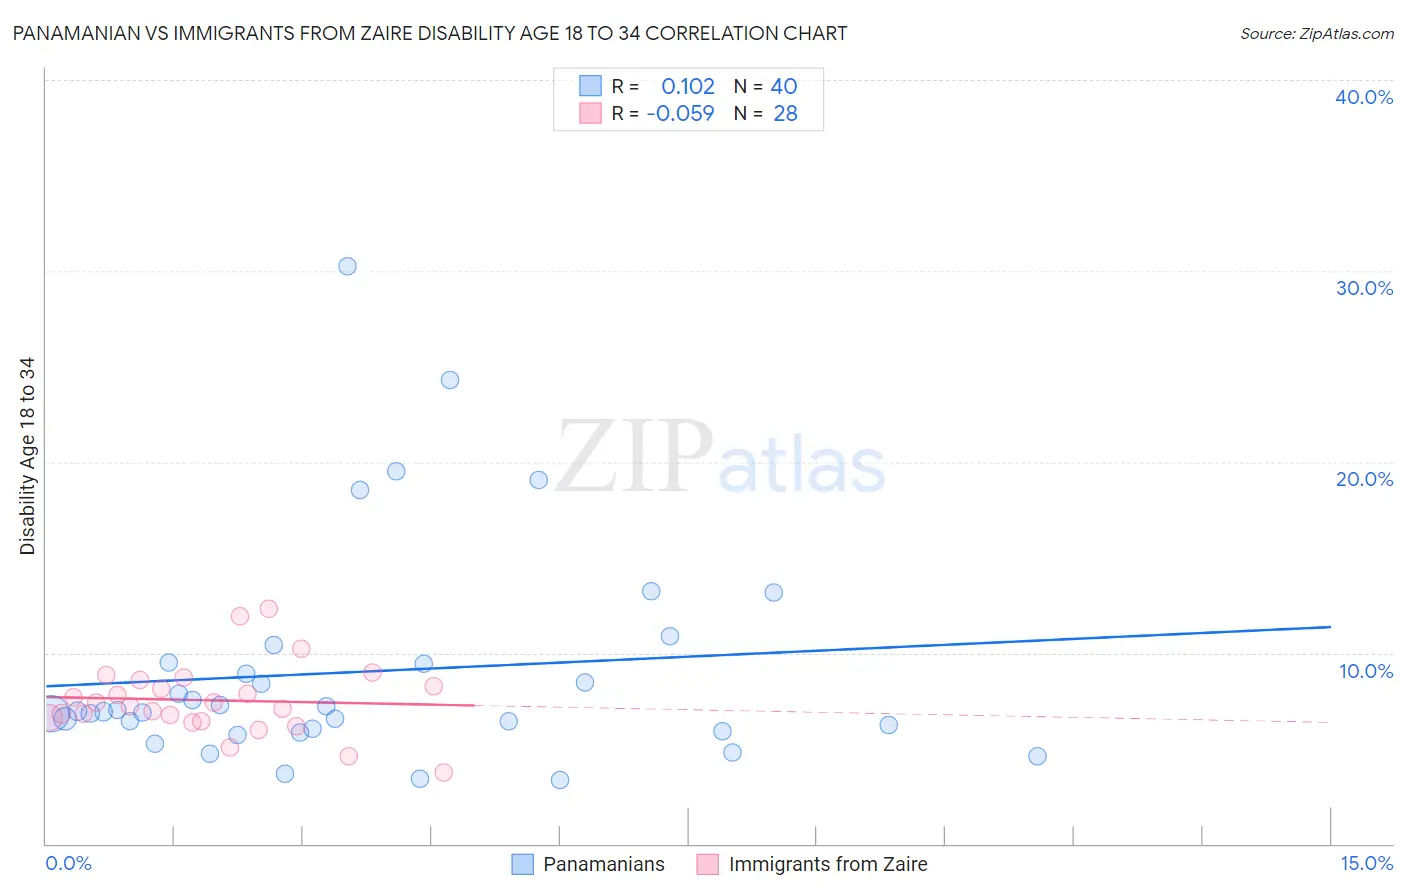
Panamanian vs Immigrants from Zaire Disability Age 18 to 34 Correlation Chart
The statistical analysis conducted on geographies consisting of 280,999,294 people shows a poor positive correlation between the proportion of Panamanians and percentage of population with a disability between the ages 18 and 35 in the United States with a correlation coefficient (R) of 0.102 and weighted average of 6.8%. Similarly, the statistical analysis conducted on geographies consisting of 107,219,427 people shows a slight negative correlation between the proportion of Immigrants from Zaire and percentage of population with a disability between the ages 18 and 35 in the United States with a correlation coefficient (R) of -0.059 and weighted average of 7.1%, a difference of 5.1%.
Disability Age 18 to 34 Correlation Summary
| Measurement | Panamanian | Immigrants from Zaire |
| Minimum | 3.4% | 3.7% |
| Maximum | 30.3% | 12.3% |
| Range | 26.9% | 8.6% |
| Mean | 9.0% | 7.5% |
| Median | 6.9% | 7.3% |
| Interquartile 25% (IQ1) | 6.0% | 6.5% |
| Interquartile 75% (IQ3) | 9.4% | 8.4% |
| Interquartile Range (IQR) | 3.5% | 1.9% |
| Standard Deviation (Sample) | 5.8% | 1.9% |
| Standard Deviation (Population) | 5.7% | 1.9% |
Similar Demographics by Disability Age 18 to 34
Demographics Similar to Panamanians by Disability Age 18 to 34
In terms of disability age 18 to 34, the demographic groups most similar to Panamanians are Greek (6.8%, a difference of 0.040%), Sierra Leonean (6.8%, a difference of 0.21%), Hispanic or Latino (6.8%, a difference of 0.26%), Immigrants from Bosnia and Herzegovina (6.8%, a difference of 0.29%), and Kenyan (6.8%, a difference of 0.30%).
| Demographics | Rating | Rank | Disability Age 18 to 34 |
| Mexican American Indians | 22.3 /100 | #195 | Fair 6.7% |
| Immigrants | Netherlands | 21.0 /100 | #196 | Fair 6.7% |
| Estonians | 20.6 /100 | #197 | Fair 6.8% |
| Australians | 19.4 /100 | #198 | Poor 6.8% |
| Kenyans | 18.3 /100 | #199 | Poor 6.8% |
| Sierra Leoneans | 17.5 /100 | #200 | Poor 6.8% |
| Greeks | 16.1 /100 | #201 | Poor 6.8% |
| Panamanians | 15.8 /100 | #202 | Poor 6.8% |
| Hispanics or Latinos | 13.8 /100 | #203 | Poor 6.8% |
| Immigrants | Bosnia and Herzegovina | 13.6 /100 | #204 | Poor 6.8% |
| Lebanese | 13.3 /100 | #205 | Poor 6.8% |
| Japanese | 12.8 /100 | #206 | Poor 6.8% |
| Mexicans | 12.6 /100 | #207 | Poor 6.8% |
| Immigrants | Scotland | 12.4 /100 | #208 | Poor 6.8% |
| Immigrants | Burma/Myanmar | 12.3 /100 | #209 | Poor 6.8% |
Demographics Similar to Immigrants from Zaire by Disability Age 18 to 34
In terms of disability age 18 to 34, the demographic groups most similar to Immigrants from Zaire are Hungarian (7.1%, a difference of 0.10%), Immigrants from Liberia (7.1%, a difference of 0.12%), Icelander (7.1%, a difference of 0.20%), Immigrants from Congo (7.1%, a difference of 0.27%), and Yugoslavian (7.2%, a difference of 0.27%).
| Demographics | Rating | Rank | Disability Age 18 to 34 |
| Austrians | 1.3 /100 | #237 | Tragic 7.1% |
| Marshallese | 1.3 /100 | #238 | Tragic 7.1% |
| Italians | 1.2 /100 | #239 | Tragic 7.1% |
| Arapaho | 1.1 /100 | #240 | Tragic 7.1% |
| Nepalese | 1.1 /100 | #241 | Tragic 7.1% |
| Immigrants | Congo | 1.1 /100 | #242 | Tragic 7.1% |
| Icelanders | 1.0 /100 | #243 | Tragic 7.1% |
| Immigrants | Zaire | 0.9 /100 | #244 | Tragic 7.1% |
| Hungarians | 0.9 /100 | #245 | Tragic 7.1% |
| Immigrants | Liberia | 0.8 /100 | #246 | Tragic 7.1% |
| Yugoslavians | 0.8 /100 | #247 | Tragic 7.2% |
| Guamanians/Chamorros | 0.8 /100 | #248 | Tragic 7.2% |
| Malaysians | 0.7 /100 | #249 | Tragic 7.2% |
| Fijians | 0.6 /100 | #250 | Tragic 7.2% |
| Spaniards | 0.6 /100 | #251 | Tragic 7.2% |