Paiute vs Kiowa Disability Age 18 to 34
COMPARE
Paiute
Kiowa
Disability Age 18 to 34
Disability Age 18 to 34 Comparison
Paiute
Kiowa
7.5%
DISABILITY AGE 18 TO 34
0.0/ 100
METRIC RATING
281st/ 347
METRIC RANK
8.8%
DISABILITY AGE 18 TO 34
0.0/ 100
METRIC RATING
339th/ 347
METRIC RANK
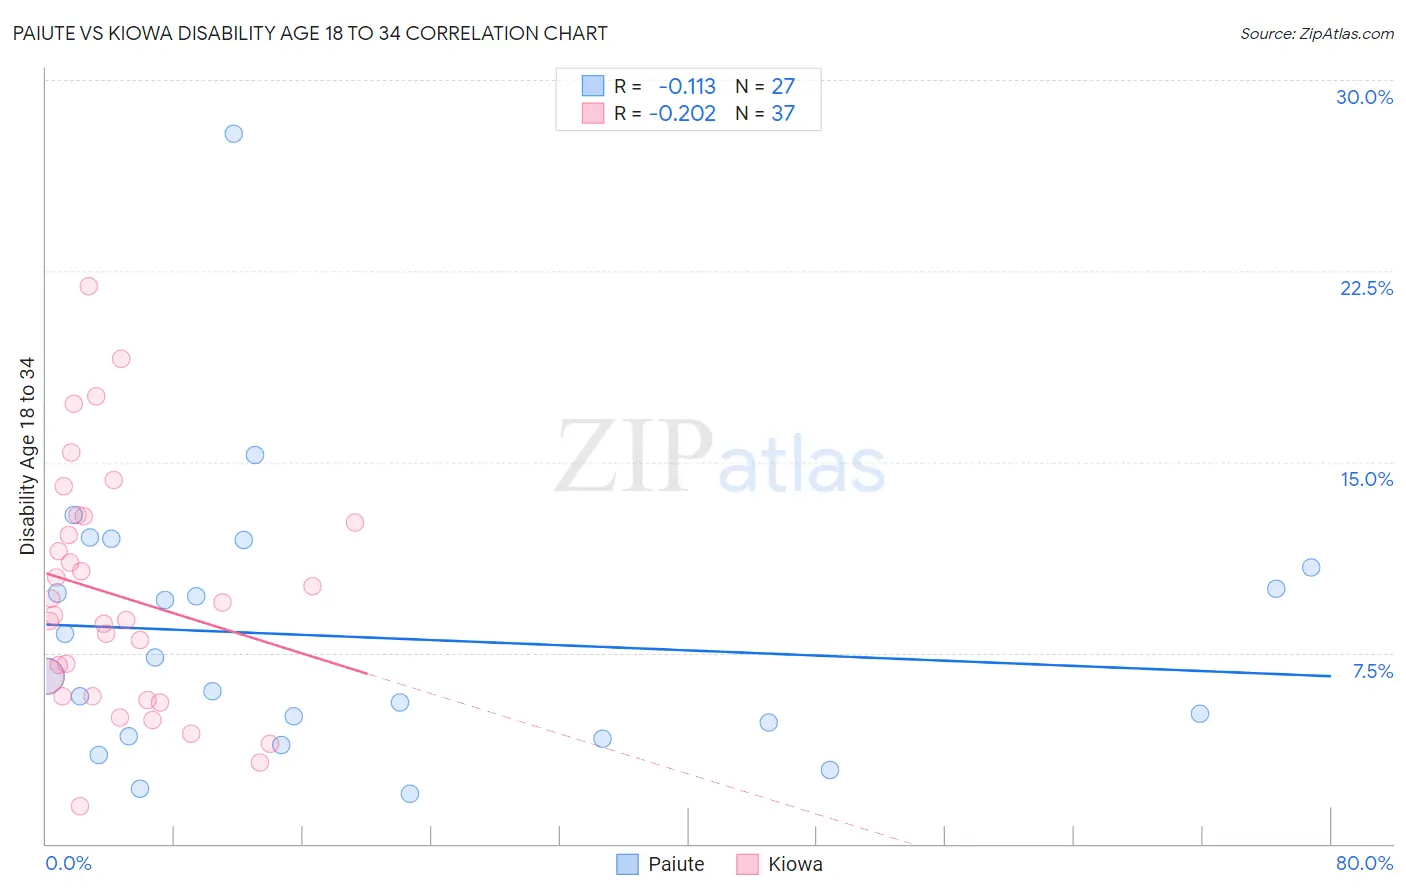
Paiute vs Kiowa Disability Age 18 to 34 Correlation Chart
The statistical analysis conducted on geographies consisting of 58,354,708 people shows a poor negative correlation between the proportion of Paiute and percentage of population with a disability between the ages 18 and 35 in the United States with a correlation coefficient (R) of -0.113 and weighted average of 7.5%. Similarly, the statistical analysis conducted on geographies consisting of 56,081,204 people shows a weak negative correlation between the proportion of Kiowa and percentage of population with a disability between the ages 18 and 35 in the United States with a correlation coefficient (R) of -0.202 and weighted average of 8.8%, a difference of 18.1%.
Disability Age 18 to 34 Correlation Summary
| Measurement | Paiute | Kiowa |
| Minimum | 2.0% | 1.5% |
| Maximum | 27.9% | 21.9% |
| Range | 25.9% | 20.4% |
| Mean | 8.1% | 9.7% |
| Median | 6.6% | 9.0% |
| Interquartile 25% (IQ1) | 4.2% | 5.8% |
| Interquartile 75% (IQ3) | 10.9% | 12.7% |
| Interquartile Range (IQR) | 6.6% | 7.0% |
| Standard Deviation (Sample) | 5.4% | 4.7% |
| Standard Deviation (Population) | 5.3% | 4.6% |
Similar Demographics by Disability Age 18 to 34
Demographics Similar to Paiute by Disability Age 18 to 34
In terms of disability age 18 to 34, the demographic groups most similar to Paiute are Spanish (7.5%, a difference of 0.20%), Danish (7.5%, a difference of 0.30%), Hopi (7.5%, a difference of 0.44%), Yaqui (7.4%, a difference of 0.48%), and Czechoslovakian (7.4%, a difference of 0.49%).
| Demographics | Rating | Rank | Disability Age 18 to 34 |
| Africans | 0.1 /100 | #274 | Tragic 7.4% |
| Immigrants | Somalia | 0.1 /100 | #275 | Tragic 7.4% |
| Europeans | 0.1 /100 | #276 | Tragic 7.4% |
| Immigrants | Portugal | 0.1 /100 | #277 | Tragic 7.4% |
| Lumbee | 0.1 /100 | #278 | Tragic 7.4% |
| Czechoslovakians | 0.1 /100 | #279 | Tragic 7.4% |
| Yaqui | 0.1 /100 | #280 | Tragic 7.4% |
| Paiute | 0.0 /100 | #281 | Tragic 7.5% |
| Spanish | 0.0 /100 | #282 | Tragic 7.5% |
| Danes | 0.0 /100 | #283 | Tragic 7.5% |
| Hopi | 0.0 /100 | #284 | Tragic 7.5% |
| Swedes | 0.0 /100 | #285 | Tragic 7.5% |
| Celtics | 0.0 /100 | #286 | Tragic 7.6% |
| Norwegians | 0.0 /100 | #287 | Tragic 7.6% |
| Whites/Caucasians | 0.0 /100 | #288 | Tragic 7.6% |
Demographics Similar to Kiowa by Disability Age 18 to 34
In terms of disability age 18 to 34, the demographic groups most similar to Kiowa are Cherokee (8.7%, a difference of 1.4%), Choctaw (9.0%, a difference of 1.5%), Chickasaw (9.0%, a difference of 1.6%), Yakama (9.0%, a difference of 1.6%), and Chippewa (9.0%, a difference of 1.6%).
| Demographics | Rating | Rank | Disability Age 18 to 34 |
| Puget Sound Salish | 0.0 /100 | #332 | Tragic 8.3% |
| Apache | 0.0 /100 | #333 | Tragic 8.4% |
| Dutch West Indians | 0.0 /100 | #334 | Tragic 8.4% |
| Seminole | 0.0 /100 | #335 | Tragic 8.4% |
| Immigrants | Azores | 0.0 /100 | #336 | Tragic 8.5% |
| Ottawa | 0.0 /100 | #337 | Tragic 8.6% |
| Cherokee | 0.0 /100 | #338 | Tragic 8.7% |
| Kiowa | 0.0 /100 | #339 | Tragic 8.8% |
| Choctaw | 0.0 /100 | #340 | Tragic 9.0% |
| Chickasaw | 0.0 /100 | #341 | Tragic 9.0% |
| Yakama | 0.0 /100 | #342 | Tragic 9.0% |
| Chippewa | 0.0 /100 | #343 | Tragic 9.0% |
| Creek | 0.0 /100 | #344 | Tragic 9.0% |
| Alaskan Athabascans | 0.0 /100 | #345 | Tragic 9.4% |
| Houma | 0.0 /100 | #346 | Tragic 9.7% |