Paiute vs Kiowa Unemployment Among Ages 30 to 34 years
COMPARE
Paiute
Kiowa
Unemployment Among Ages 30 to 34 years
Unemployment Among Ages 30 to 34 years Comparison
Paiute
Kiowa
6.7%
UNEMPLOYMENT AMONG AGES 30 TO 34 YEARS
0.0/ 100
METRIC RATING
305th/ 347
METRIC RANK
6.7%
UNEMPLOYMENT AMONG AGES 30 TO 34 YEARS
0.0/ 100
METRIC RATING
304th/ 347
METRIC RANK
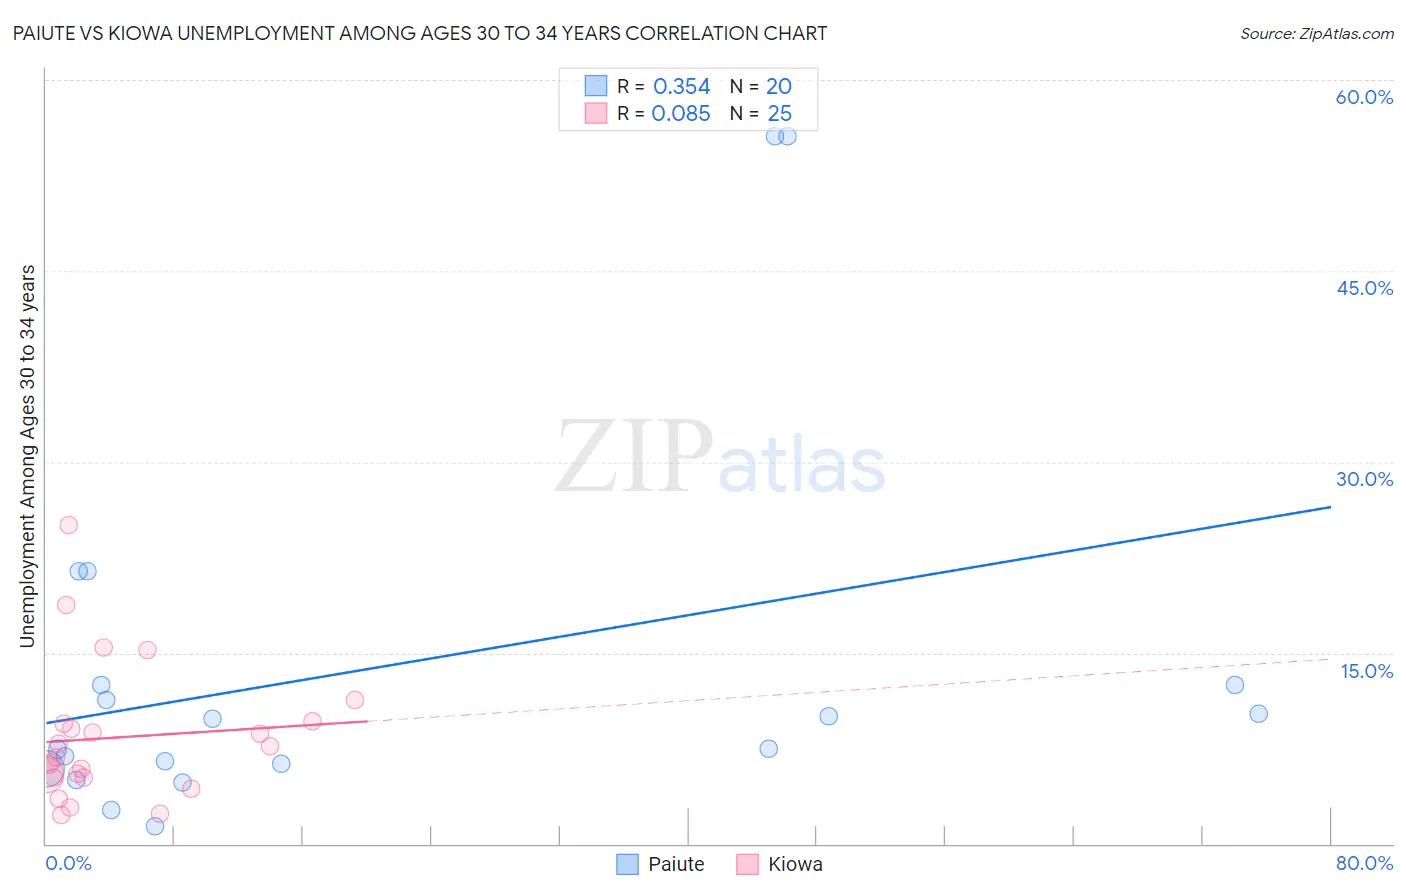
Paiute vs Kiowa Unemployment Among Ages 30 to 34 years Correlation Chart
The statistical analysis conducted on geographies consisting of 57,661,735 people shows a mild positive correlation between the proportion of Paiute and unemployment rate among population between the ages 30 and 34 in the United States with a correlation coefficient (R) of 0.354 and weighted average of 6.7%. Similarly, the statistical analysis conducted on geographies consisting of 55,274,953 people shows a slight positive correlation between the proportion of Kiowa and unemployment rate among population between the ages 30 and 34 in the United States with a correlation coefficient (R) of 0.085 and weighted average of 6.7%, a difference of 0.040%.
Unemployment Among Ages 30 to 34 years Correlation Summary
| Measurement | Paiute | Kiowa |
| Minimum | 1.4% | 2.3% |
| Maximum | 55.6% | 25.0% |
| Range | 54.2% | 22.7% |
| Mean | 13.7% | 8.3% |
| Median | 8.7% | 6.8% |
| Interquartile 25% (IQ1) | 6.1% | 5.2% |
| Interquartile 75% (IQ3) | 12.5% | 9.5% |
| Interquartile Range (IQR) | 6.4% | 4.3% |
| Standard Deviation (Sample) | 15.2% | 5.4% |
| Standard Deviation (Population) | 14.8% | 5.3% |
Demographics Similar to Paiute and Kiowa by Unemployment Among Ages 30 to 34 years
In terms of unemployment among ages 30 to 34 years, the demographic groups most similar to Paiute are Cajun (6.7%, a difference of 0.46%), Delaware (6.7%, a difference of 0.64%), Belizean (6.6%, a difference of 1.5%), Bahamian (6.6%, a difference of 1.8%), and Dutch West Indian (6.6%, a difference of 1.8%). Similarly, the demographic groups most similar to Kiowa are Cajun (6.7%, a difference of 0.42%), Delaware (6.7%, a difference of 0.61%), Belizean (6.6%, a difference of 1.5%), Bahamian (6.6%, a difference of 1.8%), and Dutch West Indian (6.6%, a difference of 1.8%).
| Demographics | Rating | Rank | Unemployment Among Ages 30 to 34 years |
| Barbadians | 0.0 /100 | #294 | Tragic 6.5% |
| Trinidadians and Tobagonians | 0.0 /100 | #295 | Tragic 6.5% |
| Immigrants | Jamaica | 0.0 /100 | #296 | Tragic 6.5% |
| Creek | 0.0 /100 | #297 | Tragic 6.6% |
| Immigrants | Barbados | 0.0 /100 | #298 | Tragic 6.6% |
| Dutch West Indians | 0.0 /100 | #299 | Tragic 6.6% |
| Bahamians | 0.0 /100 | #300 | Tragic 6.6% |
| Belizeans | 0.0 /100 | #301 | Tragic 6.6% |
| Delaware | 0.0 /100 | #302 | Tragic 6.7% |
| Cajuns | 0.0 /100 | #303 | Tragic 6.7% |
| Kiowa | 0.0 /100 | #304 | Tragic 6.7% |
| Paiute | 0.0 /100 | #305 | Tragic 6.7% |
| Immigrants | Armenia | 0.0 /100 | #306 | Tragic 6.8% |
| Immigrants | Belize | 0.0 /100 | #307 | Tragic 6.9% |
| Immigrants | Azores | 0.0 /100 | #308 | Tragic 6.9% |
| Immigrants | Grenada | 0.0 /100 | #309 | Tragic 6.9% |
| Immigrants | St. Vincent and the Grenadines | 0.0 /100 | #310 | Tragic 7.0% |
| Alaskan Athabascans | 0.0 /100 | #311 | Tragic 7.0% |
| British West Indians | 0.0 /100 | #312 | Tragic 7.0% |
| Ute | 0.0 /100 | #313 | Tragic 7.0% |
| Lumbee | 0.0 /100 | #314 | Tragic 7.1% |