Paiute vs Kiowa Householder Income Ages 25 - 44 years
COMPARE
Paiute
Kiowa
Householder Income Ages 25 - 44 years
Householder Income Ages 25 - 44 years Comparison
Paiute
Kiowa
$82,984
HOUSEHOLDER INCOME AGES 25 - 44 YEARS
0.2/ 100
METRIC RATING
277th/ 347
METRIC RANK
$74,776
HOUSEHOLDER INCOME AGES 25 - 44 YEARS
0.0/ 100
METRIC RATING
335th/ 347
METRIC RANK
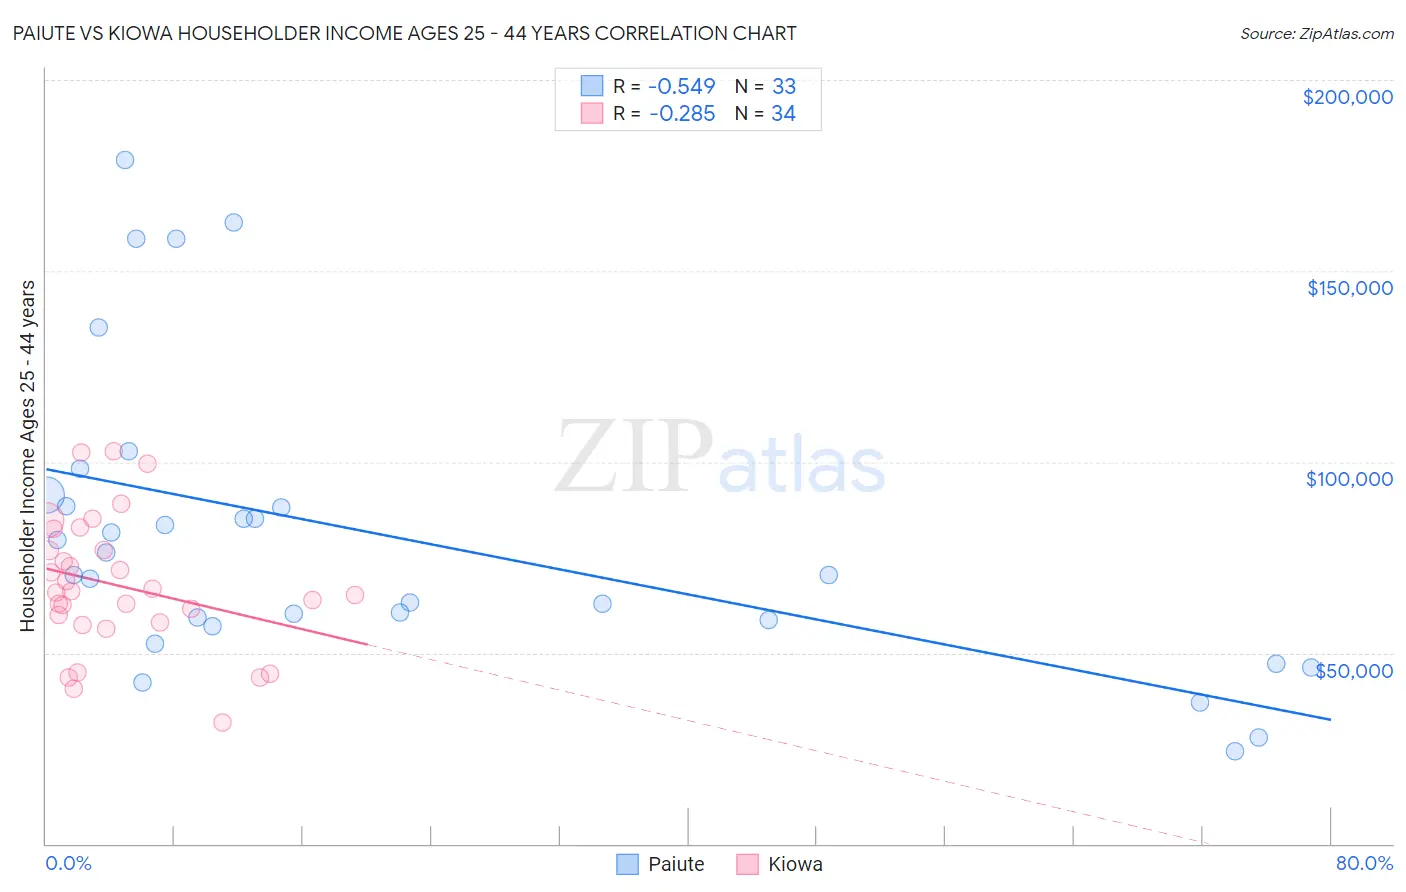
Paiute vs Kiowa Householder Income Ages 25 - 44 years Correlation Chart
The statistical analysis conducted on geographies consisting of 58,335,630 people shows a substantial negative correlation between the proportion of Paiute and household income with householder between the ages 25 and 44 in the United States with a correlation coefficient (R) of -0.549 and weighted average of $82,984. Similarly, the statistical analysis conducted on geographies consisting of 56,084,974 people shows a weak negative correlation between the proportion of Kiowa and household income with householder between the ages 25 and 44 in the United States with a correlation coefficient (R) of -0.285 and weighted average of $74,776, a difference of 11.0%.
Householder Income Ages 25 - 44 years Correlation Summary
| Measurement | Paiute | Kiowa |
| Minimum | $24,091 | $31,875 |
| Maximum | $179,063 | $102,750 |
| Range | $154,972 | $70,875 |
| Mean | $80,693 | $67,591 |
| Median | $70,417 | $65,895 |
| Interquartile 25% (IQ1) | $57,886 | $57,875 |
| Interquartile 75% (IQ3) | $89,878 | $77,000 |
| Interquartile Range (IQR) | $31,992 | $19,125 |
| Standard Deviation (Sample) | $38,861 | $17,380 |
| Standard Deviation (Population) | $38,267 | $17,122 |
Similar Demographics by Householder Income Ages 25 - 44 years
Demographics Similar to Paiute by Householder Income Ages 25 - 44 years
In terms of householder income ages 25 - 44 years, the demographic groups most similar to Paiute are Senegalese ($82,852, a difference of 0.16%), Immigrants from Belize ($83,141, a difference of 0.19%), Pima ($82,821, a difference of 0.20%), Immigrants from Jamaica ($83,298, a difference of 0.38%), and Colville ($82,604, a difference of 0.46%).
| Demographics | Rating | Rank | Householder Income Ages 25 - 44 years |
| Jamaicans | 0.3 /100 | #270 | Tragic $83,933 |
| Somalis | 0.2 /100 | #271 | Tragic $83,752 |
| Spanish Americans | 0.2 /100 | #272 | Tragic $83,722 |
| Iroquois | 0.2 /100 | #273 | Tragic $83,682 |
| Marshallese | 0.2 /100 | #274 | Tragic $83,575 |
| Immigrants | Jamaica | 0.2 /100 | #275 | Tragic $83,298 |
| Immigrants | Belize | 0.2 /100 | #276 | Tragic $83,141 |
| Paiute | 0.2 /100 | #277 | Tragic $82,984 |
| Senegalese | 0.2 /100 | #278 | Tragic $82,852 |
| Pima | 0.1 /100 | #279 | Tragic $82,821 |
| Colville | 0.1 /100 | #280 | Tragic $82,604 |
| Cajuns | 0.1 /100 | #281 | Tragic $82,393 |
| Central American Indians | 0.1 /100 | #282 | Tragic $82,355 |
| Guatemalans | 0.1 /100 | #283 | Tragic $82,331 |
| Immigrants | Middle Africa | 0.1 /100 | #284 | Tragic $82,254 |
Demographics Similar to Kiowa by Householder Income Ages 25 - 44 years
In terms of householder income ages 25 - 44 years, the demographic groups most similar to Kiowa are Creek ($74,847, a difference of 0.10%), Hopi ($75,002, a difference of 0.30%), Bahamian ($75,395, a difference of 0.83%), Native/Alaskan ($75,647, a difference of 1.2%), and Yup'ik ($73,688, a difference of 1.5%).
| Demographics | Rating | Rank | Householder Income Ages 25 - 44 years |
| Immigrants | Cuba | 0.0 /100 | #328 | Tragic $76,701 |
| Seminole | 0.0 /100 | #329 | Tragic $76,584 |
| Yakama | 0.0 /100 | #330 | Tragic $76,226 |
| Natives/Alaskans | 0.0 /100 | #331 | Tragic $75,647 |
| Bahamians | 0.0 /100 | #332 | Tragic $75,395 |
| Hopi | 0.0 /100 | #333 | Tragic $75,002 |
| Creek | 0.0 /100 | #334 | Tragic $74,847 |
| Kiowa | 0.0 /100 | #335 | Tragic $74,776 |
| Yup'ik | 0.0 /100 | #336 | Tragic $73,688 |
| Blacks/African Americans | 0.0 /100 | #337 | Tragic $73,370 |
| Immigrants | Yemen | 0.0 /100 | #338 | Tragic $73,043 |
| Yuman | 0.0 /100 | #339 | Tragic $72,956 |
| Immigrants | Congo | 0.0 /100 | #340 | Tragic $72,178 |
| Arapaho | 0.0 /100 | #341 | Tragic $71,697 |
| Crow | 0.0 /100 | #342 | Tragic $71,337 |