Okinawan vs Hawaiian Self-Care Disability
COMPARE
Okinawan
Hawaiian
Self-Care Disability
Self-Care Disability Comparison
Okinawans
Hawaiians
2.2%
SELF-CARE DISABILITY
100.0/ 100
METRIC RATING
15th/ 347
METRIC RANK
2.6%
SELF-CARE DISABILITY
0.8/ 100
METRIC RATING
243rd/ 347
METRIC RANK
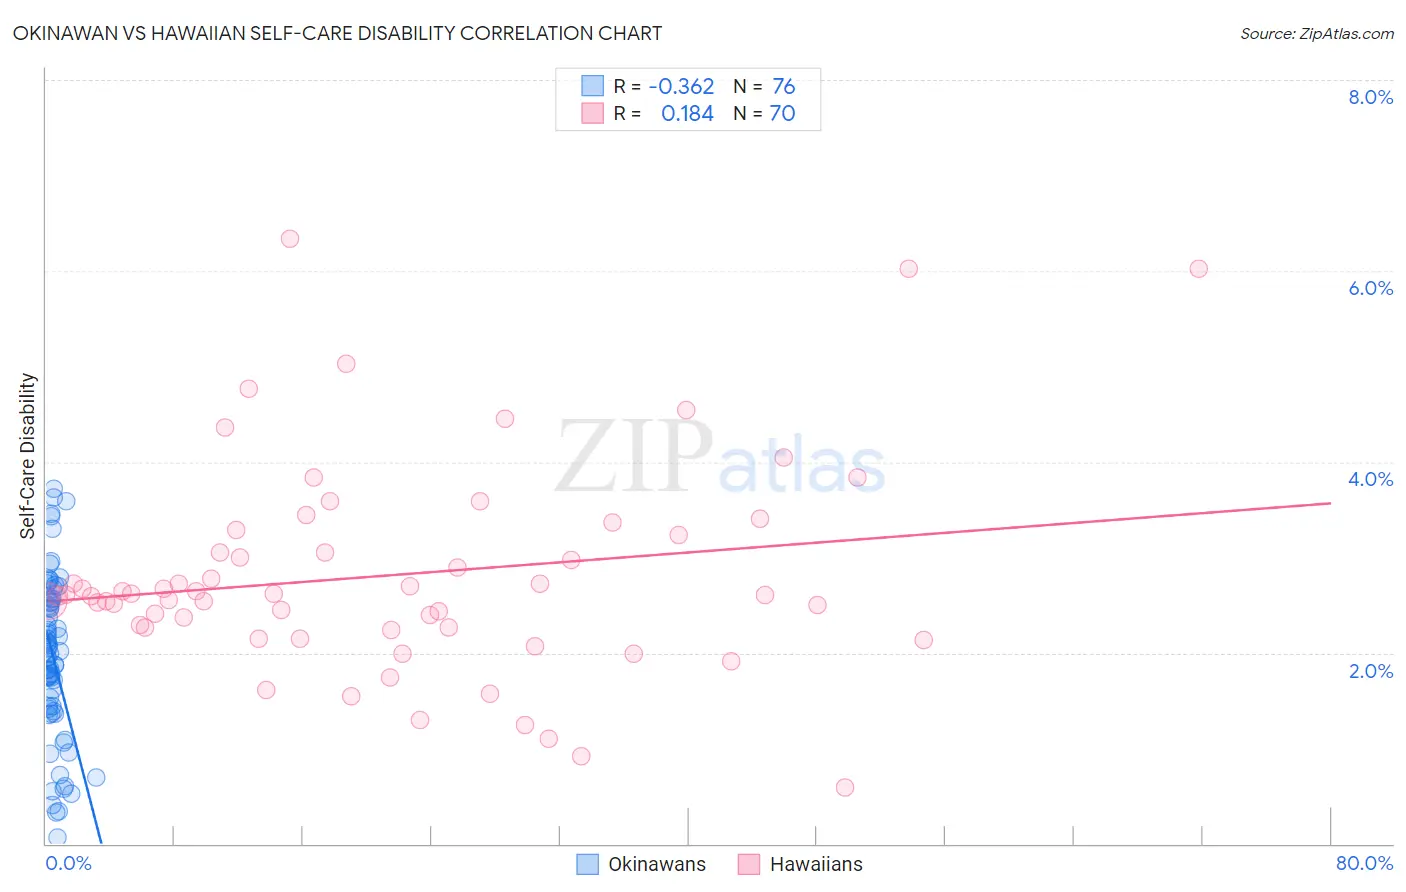
Okinawan vs Hawaiian Self-Care Disability Correlation Chart
The statistical analysis conducted on geographies consisting of 73,715,651 people shows a mild negative correlation between the proportion of Okinawans and percentage of population with self-care disability in the United States with a correlation coefficient (R) of -0.362 and weighted average of 2.2%. Similarly, the statistical analysis conducted on geographies consisting of 327,105,730 people shows a poor positive correlation between the proportion of Hawaiians and percentage of population with self-care disability in the United States with a correlation coefficient (R) of 0.184 and weighted average of 2.6%, a difference of 18.7%.
Self-Care Disability Correlation Summary
| Measurement | Okinawan | Hawaiian |
| Minimum | 0.069% | 0.59% |
| Maximum | 3.7% | 6.3% |
| Range | 3.6% | 5.8% |
| Mean | 2.0% | 2.8% |
| Median | 2.0% | 2.6% |
| Interquartile 25% (IQ1) | 1.4% | 2.3% |
| Interquartile 75% (IQ3) | 2.5% | 3.2% |
| Interquartile Range (IQR) | 1.1% | 0.97% |
| Standard Deviation (Sample) | 0.84% | 1.1% |
| Standard Deviation (Population) | 0.84% | 1.1% |
Similar Demographics by Self-Care Disability
Demographics Similar to Okinawans by Self-Care Disability
In terms of self-care disability, the demographic groups most similar to Okinawans are Luxembourger (2.2%, a difference of 0.010%), Ethiopian (2.2%, a difference of 0.17%), Immigrants from Ethiopia (2.2%, a difference of 0.18%), Immigrants from South Central Asia (2.2%, a difference of 0.23%), and Immigrants from Kuwait (2.2%, a difference of 0.28%).
| Demographics | Rating | Rank | Self-Care Disability |
| Bolivians | 100.0 /100 | #8 | Exceptional 2.2% |
| Immigrants | Nepal | 100.0 /100 | #9 | Exceptional 2.2% |
| Sudanese | 100.0 /100 | #10 | Exceptional 2.2% |
| Immigrants | South Central Asia | 100.0 /100 | #11 | Exceptional 2.2% |
| Immigrants | Ethiopia | 100.0 /100 | #12 | Exceptional 2.2% |
| Ethiopians | 100.0 /100 | #13 | Exceptional 2.2% |
| Luxembourgers | 100.0 /100 | #14 | Exceptional 2.2% |
| Okinawans | 100.0 /100 | #15 | Exceptional 2.2% |
| Immigrants | Kuwait | 100.0 /100 | #16 | Exceptional 2.2% |
| Immigrants | Saudi Arabia | 100.0 /100 | #17 | Exceptional 2.2% |
| Immigrants | Taiwan | 100.0 /100 | #18 | Exceptional 2.2% |
| Immigrants | Eritrea | 100.0 /100 | #19 | Exceptional 2.2% |
| Tongans | 100.0 /100 | #20 | Exceptional 2.2% |
| Bulgarians | 100.0 /100 | #21 | Exceptional 2.2% |
| Immigrants | Venezuela | 100.0 /100 | #22 | Exceptional 2.2% |
Demographics Similar to Hawaiians by Self-Care Disability
In terms of self-care disability, the demographic groups most similar to Hawaiians are Yuman (2.6%, a difference of 0.040%), Spanish (2.6%, a difference of 0.070%), Immigrants from Western Asia (2.6%, a difference of 0.23%), Cheyenne (2.6%, a difference of 0.25%), and Immigrants from Syria (2.6%, a difference of 0.31%).
| Demographics | Rating | Rank | Self-Care Disability |
| Bermudans | 1.9 /100 | #236 | Tragic 2.6% |
| Immigrants | Senegal | 1.6 /100 | #237 | Tragic 2.6% |
| Senegalese | 1.3 /100 | #238 | Tragic 2.6% |
| Immigrants | Panama | 1.2 /100 | #239 | Tragic 2.6% |
| Marshallese | 1.2 /100 | #240 | Tragic 2.6% |
| Immigrants | Syria | 1.0 /100 | #241 | Tragic 2.6% |
| Spanish | 0.8 /100 | #242 | Tragic 2.6% |
| Hawaiians | 0.8 /100 | #243 | Tragic 2.6% |
| Yuman | 0.8 /100 | #244 | Tragic 2.6% |
| Immigrants | Western Asia | 0.6 /100 | #245 | Tragic 2.6% |
| Cheyenne | 0.6 /100 | #246 | Tragic 2.6% |
| Immigrants | Albania | 0.6 /100 | #247 | Tragic 2.6% |
| Nicaraguans | 0.6 /100 | #248 | Tragic 2.6% |
| Mexican American Indians | 0.5 /100 | #249 | Tragic 2.6% |
| Portuguese | 0.4 /100 | #250 | Tragic 2.6% |