Okinawan vs Immigrants from Uganda Self-Care Disability
COMPARE
Okinawan
Immigrants from Uganda
Self-Care Disability
Self-Care Disability Comparison
Okinawans
Immigrants from Uganda
2.2%
SELF-CARE DISABILITY
100.0/ 100
METRIC RATING
15th/ 347
METRIC RANK
2.3%
SELF-CARE DISABILITY
99.8/ 100
METRIC RATING
42nd/ 347
METRIC RANK
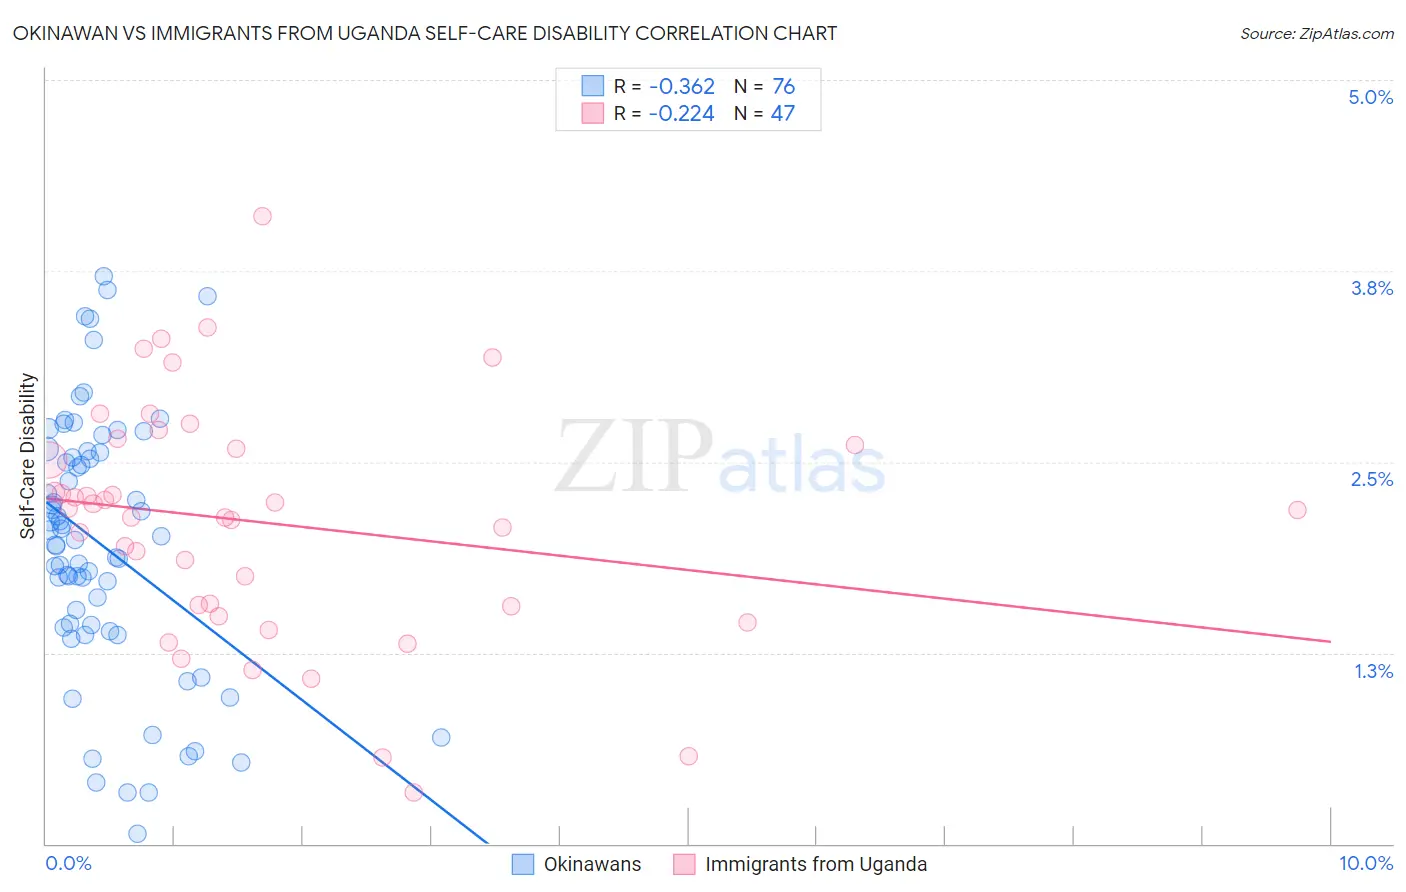
Okinawan vs Immigrants from Uganda Self-Care Disability Correlation Chart
The statistical analysis conducted on geographies consisting of 73,715,651 people shows a mild negative correlation between the proportion of Okinawans and percentage of population with self-care disability in the United States with a correlation coefficient (R) of -0.362 and weighted average of 2.2%. Similarly, the statistical analysis conducted on geographies consisting of 125,933,706 people shows a weak negative correlation between the proportion of Immigrants from Uganda and percentage of population with self-care disability in the United States with a correlation coefficient (R) of -0.224 and weighted average of 2.3%, a difference of 3.8%.
Self-Care Disability Correlation Summary
| Measurement | Okinawan | Immigrants from Uganda |
| Minimum | 0.069% | 0.33% |
| Maximum | 3.7% | 4.1% |
| Range | 3.6% | 3.8% |
| Mean | 2.0% | 2.1% |
| Median | 2.0% | 2.2% |
| Interquartile 25% (IQ1) | 1.4% | 1.6% |
| Interquartile 75% (IQ3) | 2.5% | 2.6% |
| Interquartile Range (IQR) | 1.1% | 1.1% |
| Standard Deviation (Sample) | 0.84% | 0.78% |
| Standard Deviation (Population) | 0.84% | 0.77% |
Similar Demographics by Self-Care Disability
Demographics Similar to Okinawans by Self-Care Disability
In terms of self-care disability, the demographic groups most similar to Okinawans are Luxembourger (2.2%, a difference of 0.010%), Ethiopian (2.2%, a difference of 0.17%), Immigrants from Ethiopia (2.2%, a difference of 0.18%), Immigrants from South Central Asia (2.2%, a difference of 0.23%), and Immigrants from Kuwait (2.2%, a difference of 0.28%).
| Demographics | Rating | Rank | Self-Care Disability |
| Bolivians | 100.0 /100 | #8 | Exceptional 2.2% |
| Immigrants | Nepal | 100.0 /100 | #9 | Exceptional 2.2% |
| Sudanese | 100.0 /100 | #10 | Exceptional 2.2% |
| Immigrants | South Central Asia | 100.0 /100 | #11 | Exceptional 2.2% |
| Immigrants | Ethiopia | 100.0 /100 | #12 | Exceptional 2.2% |
| Ethiopians | 100.0 /100 | #13 | Exceptional 2.2% |
| Luxembourgers | 100.0 /100 | #14 | Exceptional 2.2% |
| Okinawans | 100.0 /100 | #15 | Exceptional 2.2% |
| Immigrants | Kuwait | 100.0 /100 | #16 | Exceptional 2.2% |
| Immigrants | Saudi Arabia | 100.0 /100 | #17 | Exceptional 2.2% |
| Immigrants | Taiwan | 100.0 /100 | #18 | Exceptional 2.2% |
| Immigrants | Eritrea | 100.0 /100 | #19 | Exceptional 2.2% |
| Tongans | 100.0 /100 | #20 | Exceptional 2.2% |
| Bulgarians | 100.0 /100 | #21 | Exceptional 2.2% |
| Immigrants | Venezuela | 100.0 /100 | #22 | Exceptional 2.2% |
Demographics Similar to Immigrants from Uganda by Self-Care Disability
In terms of self-care disability, the demographic groups most similar to Immigrants from Uganda are Immigrants from Pakistan (2.3%, a difference of 0.050%), Immigrants from South Africa (2.3%, a difference of 0.090%), Immigrants from Sudan (2.3%, a difference of 0.10%), Norwegian (2.3%, a difference of 0.13%), and Iranian (2.3%, a difference of 0.17%).
| Demographics | Rating | Rank | Self-Care Disability |
| Immigrants | Australia | 99.9 /100 | #35 | Exceptional 2.3% |
| Immigrants | Lithuania | 99.9 /100 | #36 | Exceptional 2.3% |
| Immigrants | Sweden | 99.9 /100 | #37 | Exceptional 2.3% |
| Immigrants | Eastern Africa | 99.9 /100 | #38 | Exceptional 2.3% |
| Immigrants | Bulgaria | 99.8 /100 | #39 | Exceptional 2.3% |
| Iranians | 99.8 /100 | #40 | Exceptional 2.3% |
| Immigrants | Sudan | 99.8 /100 | #41 | Exceptional 2.3% |
| Immigrants | Uganda | 99.8 /100 | #42 | Exceptional 2.3% |
| Immigrants | Pakistan | 99.8 /100 | #43 | Exceptional 2.3% |
| Immigrants | South Africa | 99.8 /100 | #44 | Exceptional 2.3% |
| Norwegians | 99.8 /100 | #45 | Exceptional 2.3% |
| Czechs | 99.8 /100 | #46 | Exceptional 2.3% |
| Jordanians | 99.7 /100 | #47 | Exceptional 2.3% |
| Immigrants | Malaysia | 99.7 /100 | #48 | Exceptional 2.3% |
| Latvians | 99.7 /100 | #49 | Exceptional 2.3% |