Nonimmigrants vs Immigrants from Southern Europe Disability Age 65 to 74
COMPARE
Nonimmigrants
Immigrants from Southern Europe
Disability Age 65 to 74
Disability Age 65 to 74 Comparison
Nonimmigrants
Immigrants from Southern Europe
25.0%
DISABILITY AGE 65 TO 74
0.7/ 100
METRIC RATING
251st/ 347
METRIC RANK
22.1%
DISABILITY AGE 65 TO 74
97.2/ 100
METRIC RATING
97th/ 347
METRIC RANK
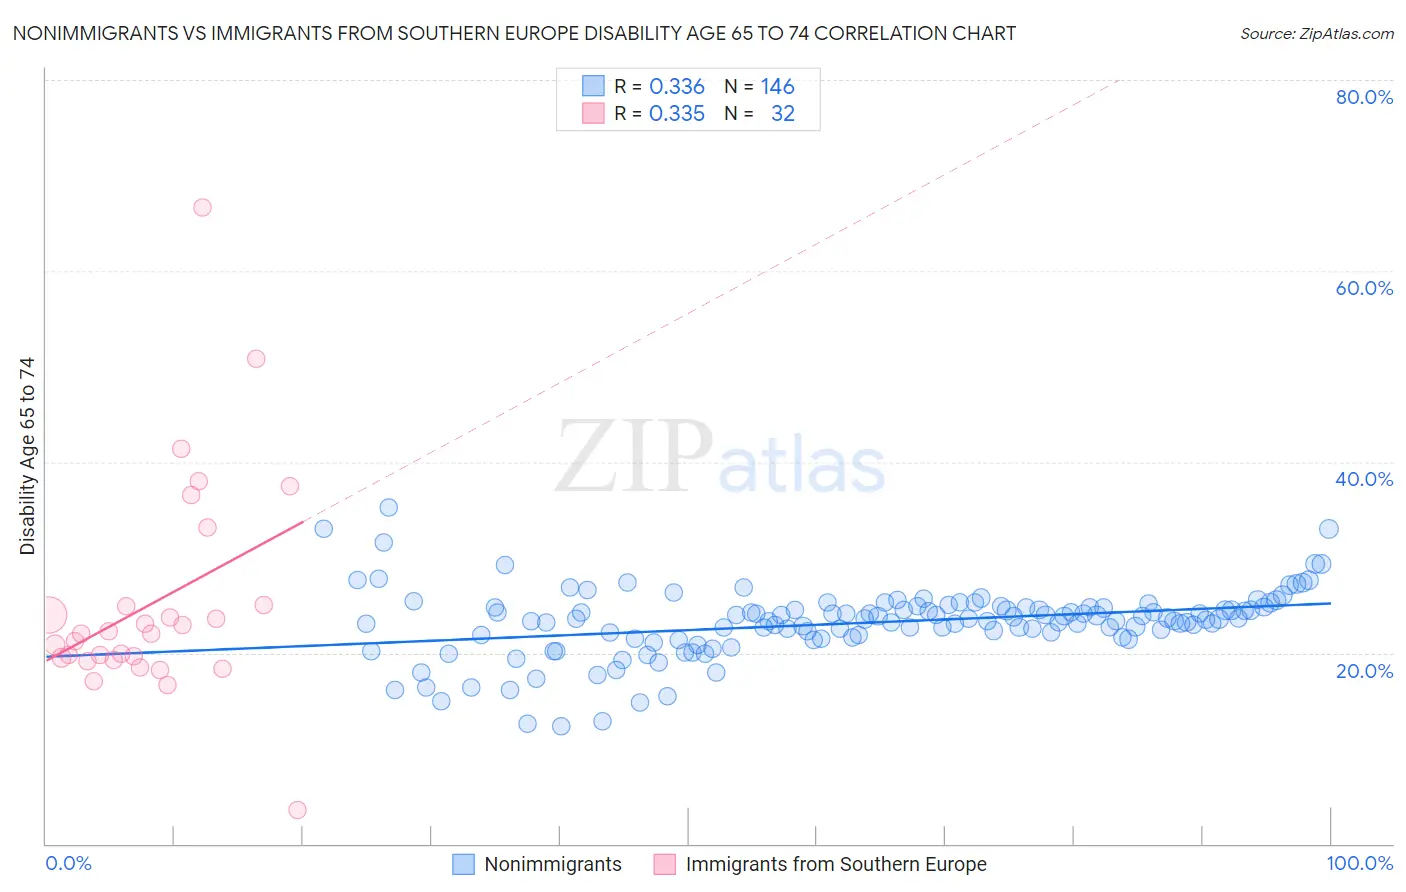
Nonimmigrants vs Immigrants from Southern Europe Disability Age 65 to 74 Correlation Chart
The statistical analysis conducted on geographies consisting of 581,657,399 people shows a mild positive correlation between the proportion of Nonimmigrants and percentage of population with a disability between the ages 65 and 75 in the United States with a correlation coefficient (R) of 0.336 and weighted average of 25.0%. Similarly, the statistical analysis conducted on geographies consisting of 402,150,656 people shows a mild positive correlation between the proportion of Immigrants from Southern Europe and percentage of population with a disability between the ages 65 and 75 in the United States with a correlation coefficient (R) of 0.335 and weighted average of 22.1%, a difference of 13.1%.
Disability Age 65 to 74 Correlation Summary
| Measurement | Nonimmigrants | Immigrants from Southern Europe |
| Minimum | 12.3% | 3.5% |
| Maximum | 35.2% | 66.7% |
| Range | 22.8% | 63.2% |
| Mean | 23.1% | 25.3% |
| Median | 23.5% | 22.0% |
| Interquartile 25% (IQ1) | 21.7% | 19.4% |
| Interquartile 75% (IQ3) | 24.8% | 24.9% |
| Interquartile Range (IQR) | 3.1% | 5.6% |
| Standard Deviation (Sample) | 3.6% | 11.6% |
| Standard Deviation (Population) | 3.6% | 11.5% |
Similar Demographics by Disability Age 65 to 74
Demographics Similar to Nonimmigrants by Disability Age 65 to 74
In terms of disability age 65 to 74, the demographic groups most similar to Nonimmigrants are Immigrants from El Salvador (25.1%, a difference of 0.19%), Salvadoran (25.0%, a difference of 0.20%), Immigrants from Fiji (25.0%, a difference of 0.22%), Subsaharan African (25.1%, a difference of 0.23%), and Somali (25.1%, a difference of 0.30%).
| Demographics | Rating | Rank | Disability Age 65 to 74 |
| Armenians | 2.0 /100 | #244 | Tragic 24.7% |
| British West Indians | 2.0 /100 | #245 | Tragic 24.7% |
| Immigrants | Iraq | 1.9 /100 | #246 | Tragic 24.7% |
| Indonesians | 1.1 /100 | #247 | Tragic 24.9% |
| Senegalese | 0.9 /100 | #248 | Tragic 24.9% |
| Immigrants | Fiji | 0.8 /100 | #249 | Tragic 25.0% |
| Salvadorans | 0.8 /100 | #250 | Tragic 25.0% |
| Immigrants | Nonimmigrants | 0.7 /100 | #251 | Tragic 25.0% |
| Immigrants | El Salvador | 0.6 /100 | #252 | Tragic 25.1% |
| Sub-Saharan Africans | 0.6 /100 | #253 | Tragic 25.1% |
| Somalis | 0.6 /100 | #254 | Tragic 25.1% |
| Central Americans | 0.5 /100 | #255 | Tragic 25.1% |
| Immigrants | Somalia | 0.4 /100 | #256 | Tragic 25.2% |
| Guamanians/Chamorros | 0.3 /100 | #257 | Tragic 25.3% |
| Marshallese | 0.3 /100 | #258 | Tragic 25.3% |
Demographics Similar to Immigrants from Southern Europe by Disability Age 65 to 74
In terms of disability age 65 to 74, the demographic groups most similar to Immigrants from Southern Europe are Immigrants from North America (22.1%, a difference of 0.15%), Jordanian (22.2%, a difference of 0.21%), Immigrants from Colombia (22.2%, a difference of 0.24%), Romanian (22.1%, a difference of 0.26%), and Immigrants from Chile (22.1%, a difference of 0.32%).
| Demographics | Rating | Rank | Disability Age 65 to 74 |
| Italians | 97.9 /100 | #90 | Exceptional 22.0% |
| Chileans | 97.9 /100 | #91 | Exceptional 22.0% |
| Poles | 97.8 /100 | #92 | Exceptional 22.0% |
| Immigrants | Canada | 97.8 /100 | #93 | Exceptional 22.1% |
| Immigrants | Chile | 97.7 /100 | #94 | Exceptional 22.1% |
| Romanians | 97.7 /100 | #95 | Exceptional 22.1% |
| Immigrants | North America | 97.5 /100 | #96 | Exceptional 22.1% |
| Immigrants | Southern Europe | 97.2 /100 | #97 | Exceptional 22.1% |
| Jordanians | 96.9 /100 | #98 | Exceptional 22.2% |
| Immigrants | Colombia | 96.8 /100 | #99 | Exceptional 22.2% |
| Uruguayans | 96.5 /100 | #100 | Exceptional 22.2% |
| Immigrants | England | 96.5 /100 | #101 | Exceptional 22.2% |
| Immigrants | Saudi Arabia | 96.4 /100 | #102 | Exceptional 22.2% |
| South Americans | 96.4 /100 | #103 | Exceptional 22.2% |
| Colombians | 96.4 /100 | #104 | Exceptional 22.2% |