Nonimmigrants vs French Disability Age 65 to 74
COMPARE
Nonimmigrants
French
Disability Age 65 to 74
Disability Age 65 to 74 Comparison
Nonimmigrants
French
25.0%
DISABILITY AGE 65 TO 74
0.7/ 100
METRIC RATING
251st/ 347
METRIC RANK
23.9%
DISABILITY AGE 65 TO 74
15.7/ 100
METRIC RATING
212th/ 347
METRIC RANK
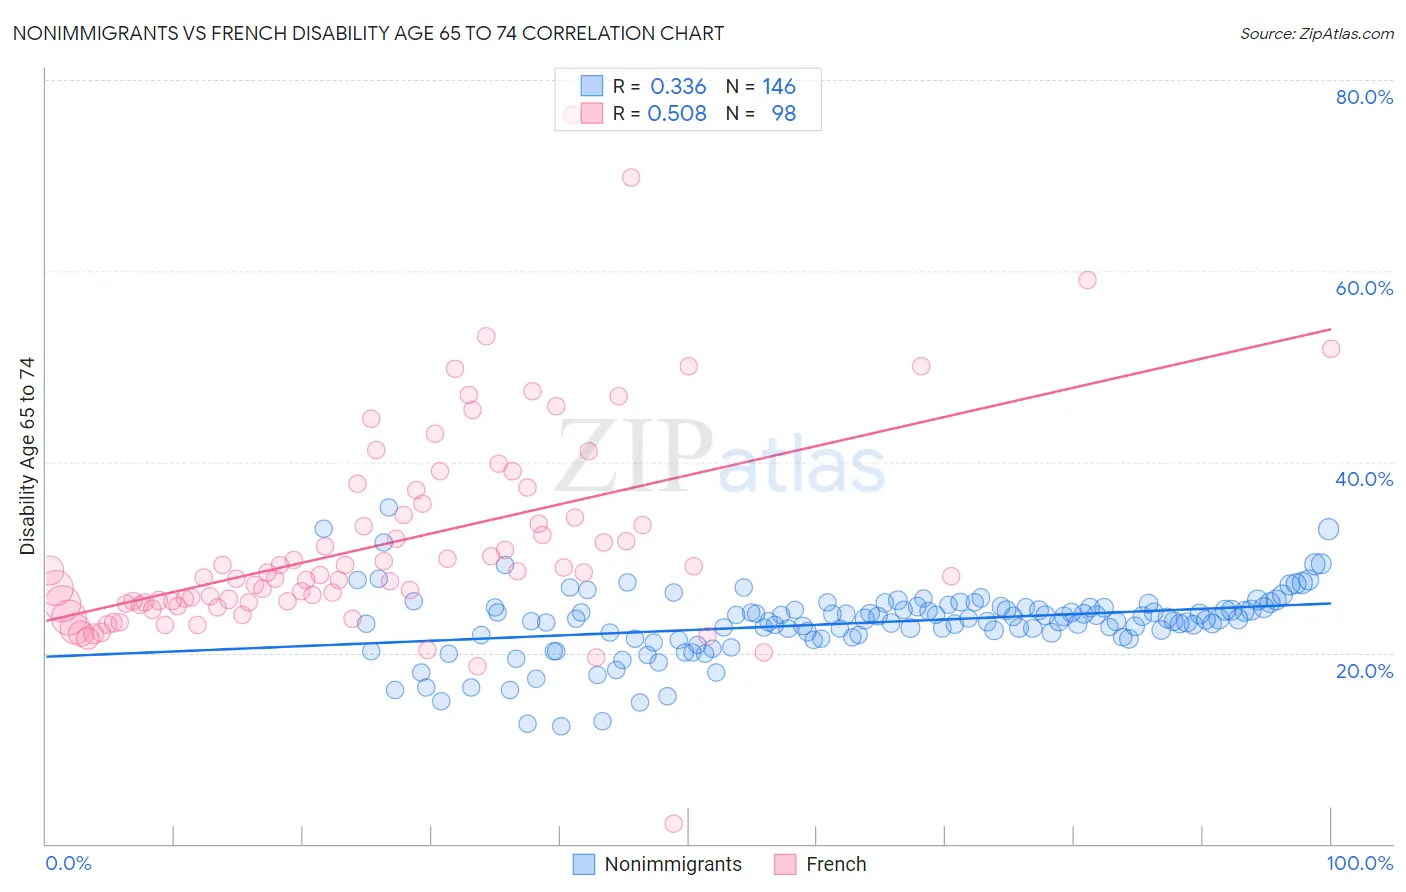
Nonimmigrants vs French Disability Age 65 to 74 Correlation Chart
The statistical analysis conducted on geographies consisting of 581,657,399 people shows a mild positive correlation between the proportion of Nonimmigrants and percentage of population with a disability between the ages 65 and 75 in the United States with a correlation coefficient (R) of 0.336 and weighted average of 25.0%. Similarly, the statistical analysis conducted on geographies consisting of 569,976,076 people shows a substantial positive correlation between the proportion of French and percentage of population with a disability between the ages 65 and 75 in the United States with a correlation coefficient (R) of 0.508 and weighted average of 23.9%, a difference of 4.6%.
Disability Age 65 to 74 Correlation Summary
| Measurement | Nonimmigrants | French |
| Minimum | 12.3% | 2.1% |
| Maximum | 35.2% | 76.3% |
| Range | 22.8% | 74.2% |
| Mean | 23.1% | 31.4% |
| Median | 23.5% | 28.1% |
| Interquartile 25% (IQ1) | 21.7% | 25.1% |
| Interquartile 75% (IQ3) | 24.8% | 34.4% |
| Interquartile Range (IQR) | 3.1% | 9.3% |
| Standard Deviation (Sample) | 3.6% | 10.9% |
| Standard Deviation (Population) | 3.6% | 10.9% |
Similar Demographics by Disability Age 65 to 74
Demographics Similar to Nonimmigrants by Disability Age 65 to 74
In terms of disability age 65 to 74, the demographic groups most similar to Nonimmigrants are Immigrants from El Salvador (25.1%, a difference of 0.19%), Salvadoran (25.0%, a difference of 0.20%), Immigrants from Fiji (25.0%, a difference of 0.22%), Subsaharan African (25.1%, a difference of 0.23%), and Somali (25.1%, a difference of 0.30%).
| Demographics | Rating | Rank | Disability Age 65 to 74 |
| Armenians | 2.0 /100 | #244 | Tragic 24.7% |
| British West Indians | 2.0 /100 | #245 | Tragic 24.7% |
| Immigrants | Iraq | 1.9 /100 | #246 | Tragic 24.7% |
| Indonesians | 1.1 /100 | #247 | Tragic 24.9% |
| Senegalese | 0.9 /100 | #248 | Tragic 24.9% |
| Immigrants | Fiji | 0.8 /100 | #249 | Tragic 25.0% |
| Salvadorans | 0.8 /100 | #250 | Tragic 25.0% |
| Immigrants | Nonimmigrants | 0.7 /100 | #251 | Tragic 25.0% |
| Immigrants | El Salvador | 0.6 /100 | #252 | Tragic 25.1% |
| Sub-Saharan Africans | 0.6 /100 | #253 | Tragic 25.1% |
| Somalis | 0.6 /100 | #254 | Tragic 25.1% |
| Central Americans | 0.5 /100 | #255 | Tragic 25.1% |
| Immigrants | Somalia | 0.4 /100 | #256 | Tragic 25.2% |
| Guamanians/Chamorros | 0.3 /100 | #257 | Tragic 25.3% |
| Marshallese | 0.3 /100 | #258 | Tragic 25.3% |
Demographics Similar to French by Disability Age 65 to 74
In terms of disability age 65 to 74, the demographic groups most similar to French are Immigrants from West Indies (23.9%, a difference of 0.020%), Trinidadian and Tobagonian (23.9%, a difference of 0.070%), Nicaraguan (23.9%, a difference of 0.16%), Immigrants from Oceania (24.0%, a difference of 0.24%), and Pennsylvania German (24.0%, a difference of 0.28%).
| Demographics | Rating | Rank | Disability Age 65 to 74 |
| Tongans | 20.8 /100 | #205 | Fair 23.8% |
| Immigrants | Jamaica | 20.7 /100 | #206 | Fair 23.8% |
| Immigrants | Sudan | 20.1 /100 | #207 | Fair 23.8% |
| Immigrants | Barbados | 19.6 /100 | #208 | Poor 23.8% |
| Immigrants | Kenya | 19.6 /100 | #209 | Poor 23.8% |
| Trinidadians and Tobagonians | 16.4 /100 | #210 | Poor 23.9% |
| Immigrants | West Indies | 15.9 /100 | #211 | Poor 23.9% |
| French | 15.7 /100 | #212 | Poor 23.9% |
| Nicaraguans | 14.3 /100 | #213 | Poor 23.9% |
| Immigrants | Oceania | 13.6 /100 | #214 | Poor 24.0% |
| Pennsylvania Germans | 13.3 /100 | #215 | Poor 24.0% |
| Jamaicans | 12.2 /100 | #216 | Poor 24.0% |
| Immigrants | Portugal | 11.7 /100 | #217 | Poor 24.0% |
| Immigrants | Nigeria | 11.7 /100 | #218 | Poor 24.0% |
| Immigrants | Burma/Myanmar | 11.6 /100 | #219 | Poor 24.0% |