Nonimmigrants vs Immigrants from Cabo Verde 2nd Grade
COMPARE
Nonimmigrants
Immigrants from Cabo Verde
2nd Grade
2nd Grade Comparison
Nonimmigrants
Immigrants from Cabo Verde
98.2%
2ND GRADE
98.3/ 100
METRIC RATING
98th/ 347
METRIC RANK
96.3%
2ND GRADE
0.0/ 100
METRIC RATING
338th/ 347
METRIC RANK
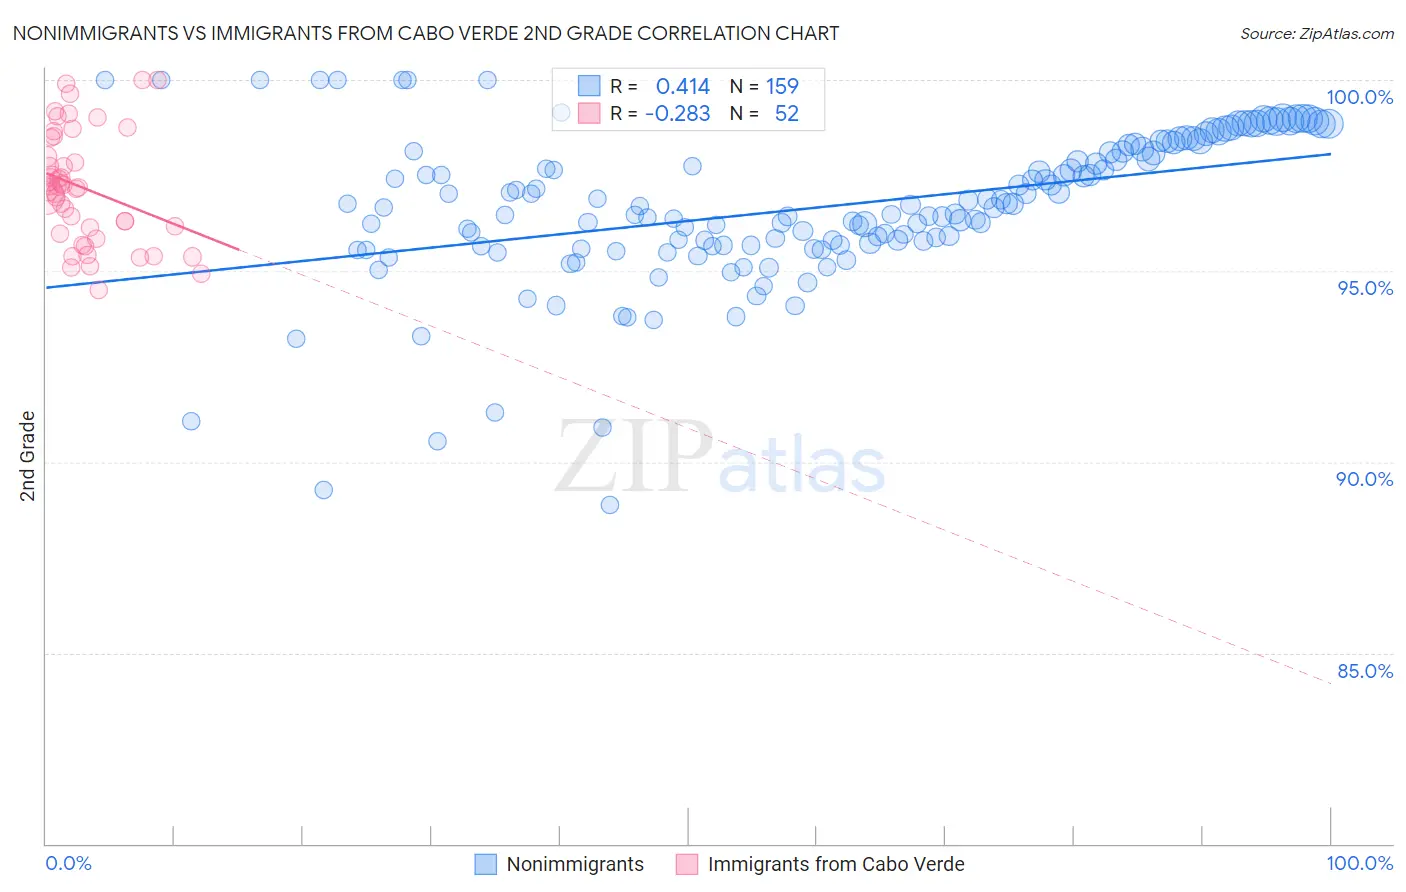
Nonimmigrants vs Immigrants from Cabo Verde 2nd Grade Correlation Chart
The statistical analysis conducted on geographies consisting of 585,374,774 people shows a moderate positive correlation between the proportion of Nonimmigrants and percentage of population with at least 2nd grade education in the United States with a correlation coefficient (R) of 0.414 and weighted average of 98.2%. Similarly, the statistical analysis conducted on geographies consisting of 38,113,948 people shows a weak negative correlation between the proportion of Immigrants from Cabo Verde and percentage of population with at least 2nd grade education in the United States with a correlation coefficient (R) of -0.283 and weighted average of 96.3%, a difference of 1.9%.
2nd Grade Correlation Summary
| Measurement | Nonimmigrants | Immigrants from Cabo Verde |
| Minimum | 88.9% | 94.5% |
| Maximum | 100.0% | 100.0% |
| Range | 11.1% | 5.5% |
| Mean | 96.7% | 97.2% |
| Median | 96.7% | 97.2% |
| Interquartile 25% (IQ1) | 95.7% | 96.1% |
| Interquartile 75% (IQ3) | 98.1% | 98.2% |
| Interquartile Range (IQR) | 2.5% | 2.2% |
| Standard Deviation (Sample) | 2.0% | 1.4% |
| Standard Deviation (Population) | 2.0% | 1.4% |
Similar Demographics by 2nd Grade
Demographics Similar to Nonimmigrants by 2nd Grade
In terms of 2nd grade, the demographic groups most similar to Nonimmigrants are Choctaw (98.2%, a difference of 0.0%), Cypriot (98.2%, a difference of 0.010%), Immigrants from Ireland (98.2%, a difference of 0.010%), Romanian (98.2%, a difference of 0.010%), and Puget Sound Salish (98.2%, a difference of 0.010%).
| Demographics | Rating | Rank | 2nd Grade |
| Immigrants | Western Europe | 98.8 /100 | #91 | Exceptional 98.2% |
| Immigrants | South Africa | 98.8 /100 | #92 | Exceptional 98.2% |
| Immigrants | India | 98.8 /100 | #93 | Exceptional 98.2% |
| Immigrants | Germany | 98.6 /100 | #94 | Exceptional 98.2% |
| South Africans | 98.6 /100 | #95 | Exceptional 98.2% |
| Cypriots | 98.4 /100 | #96 | Exceptional 98.2% |
| Choctaw | 98.3 /100 | #97 | Exceptional 98.2% |
| Immigrants | Nonimmigrants | 98.3 /100 | #98 | Exceptional 98.2% |
| Immigrants | Ireland | 98.0 /100 | #99 | Exceptional 98.2% |
| Romanians | 98.0 /100 | #100 | Exceptional 98.2% |
| Puget Sound Salish | 98.0 /100 | #101 | Exceptional 98.2% |
| Cree | 98.0 /100 | #102 | Exceptional 98.2% |
| Pima | 97.6 /100 | #103 | Exceptional 98.2% |
| Turks | 97.6 /100 | #104 | Exceptional 98.2% |
| Yugoslavians | 97.5 /100 | #105 | Exceptional 98.2% |
Demographics Similar to Immigrants from Cabo Verde by 2nd Grade
In terms of 2nd grade, the demographic groups most similar to Immigrants from Cabo Verde are Immigrants from Cambodia (96.4%, a difference of 0.020%), Immigrants from Fiji (96.4%, a difference of 0.030%), Guatemalan (96.3%, a difference of 0.030%), Yakama (96.4%, a difference of 0.040%), and Central American (96.4%, a difference of 0.050%).
| Demographics | Rating | Rank | 2nd Grade |
| Immigrants | Armenia | 0.0 /100 | #331 | Tragic 96.5% |
| Bangladeshis | 0.0 /100 | #332 | Tragic 96.5% |
| Immigrants | Dominican Republic | 0.0 /100 | #333 | Tragic 96.4% |
| Central Americans | 0.0 /100 | #334 | Tragic 96.4% |
| Yakama | 0.0 /100 | #335 | Tragic 96.4% |
| Immigrants | Fiji | 0.0 /100 | #336 | Tragic 96.4% |
| Immigrants | Cambodia | 0.0 /100 | #337 | Tragic 96.4% |
| Immigrants | Cabo Verde | 0.0 /100 | #338 | Tragic 96.3% |
| Guatemalans | 0.0 /100 | #339 | Tragic 96.3% |
| Immigrants | Guatemala | 0.0 /100 | #340 | Tragic 96.2% |
| Immigrants | Central America | 0.0 /100 | #341 | Tragic 96.2% |
| Immigrants | Mexico | 0.0 /100 | #342 | Tragic 96.1% |
| Nepalese | 0.0 /100 | #343 | Tragic 96.1% |
| Salvadorans | 0.0 /100 | #344 | Tragic 96.0% |
| Immigrants | El Salvador | 0.0 /100 | #345 | Tragic 95.9% |