Thai vs French Disability Age 65 to 74
COMPARE
Thai
French
Disability Age 65 to 74
Disability Age 65 to 74 Comparison
Thais
French
20.1%
DISABILITY AGE 65 TO 74
100.0/ 100
METRIC RATING
8th/ 347
METRIC RANK
23.9%
DISABILITY AGE 65 TO 74
15.7/ 100
METRIC RATING
212th/ 347
METRIC RANK
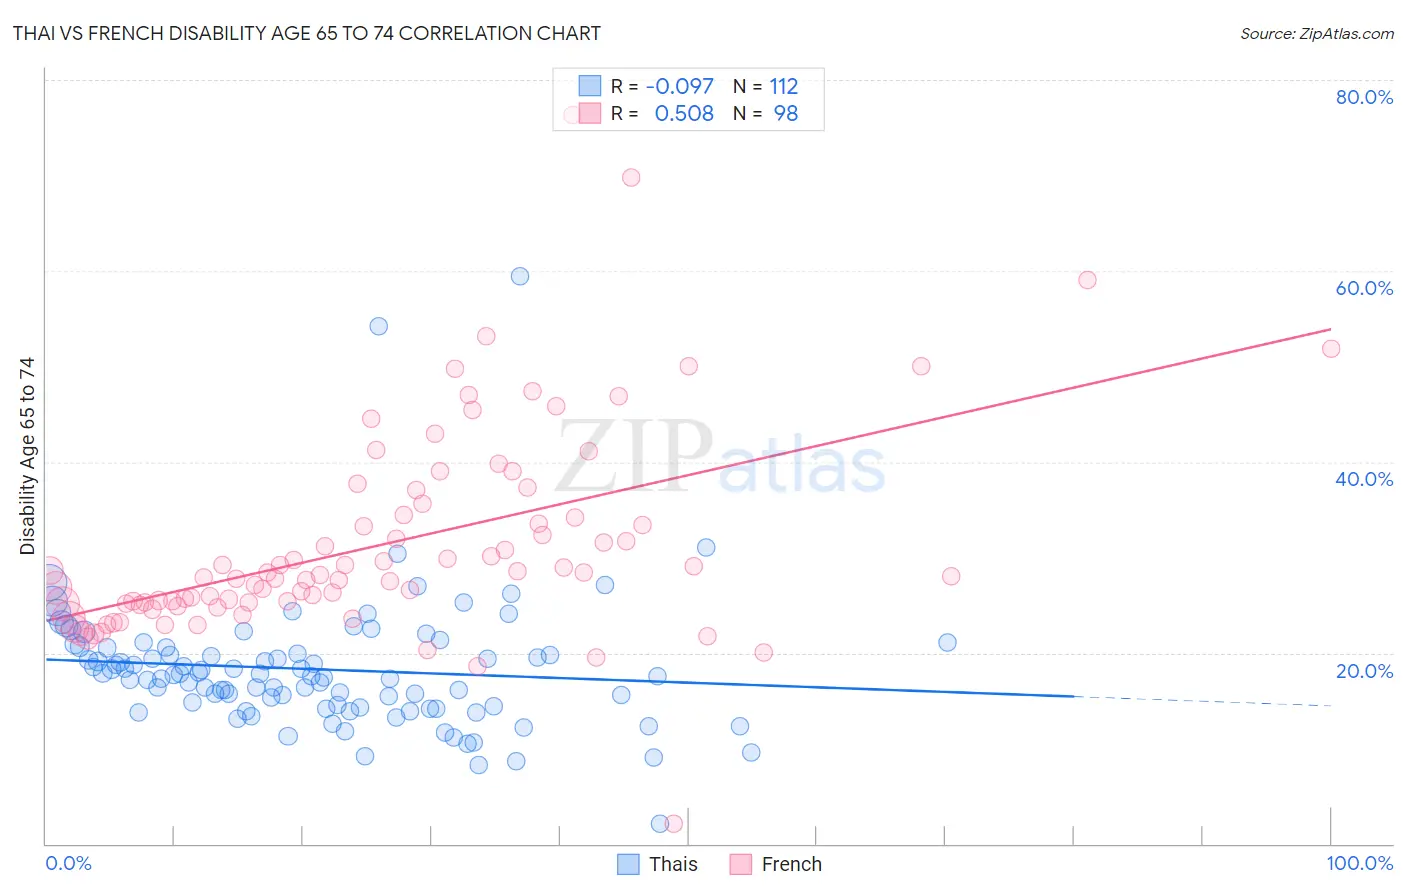
Thai vs French Disability Age 65 to 74 Correlation Chart
The statistical analysis conducted on geographies consisting of 474,585,804 people shows a slight negative correlation between the proportion of Thais and percentage of population with a disability between the ages 65 and 75 in the United States with a correlation coefficient (R) of -0.097 and weighted average of 20.1%. Similarly, the statistical analysis conducted on geographies consisting of 569,976,076 people shows a substantial positive correlation between the proportion of French and percentage of population with a disability between the ages 65 and 75 in the United States with a correlation coefficient (R) of 0.508 and weighted average of 23.9%, a difference of 19.1%.
Disability Age 65 to 74 Correlation Summary
| Measurement | Thai | French |
| Minimum | 2.1% | 2.1% |
| Maximum | 59.5% | 76.3% |
| Range | 57.4% | 74.2% |
| Mean | 18.3% | 31.4% |
| Median | 17.6% | 28.1% |
| Interquartile 25% (IQ1) | 14.3% | 25.1% |
| Interquartile 75% (IQ3) | 20.6% | 34.4% |
| Interquartile Range (IQR) | 6.3% | 9.3% |
| Standard Deviation (Sample) | 7.1% | 10.9% |
| Standard Deviation (Population) | 7.1% | 10.9% |
Similar Demographics by Disability Age 65 to 74
Demographics Similar to Thais by Disability Age 65 to 74
In terms of disability age 65 to 74, the demographic groups most similar to Thais are Cypriot (20.1%, a difference of 0.040%), Iranian (19.9%, a difference of 0.70%), Immigrants from Israel (19.9%, a difference of 0.82%), Immigrants from China (20.3%, a difference of 0.96%), and Immigrants from Eastern Asia (20.3%, a difference of 1.0%).
| Demographics | Rating | Rank | Disability Age 65 to 74 |
| Immigrants | Taiwan | 100.0 /100 | #1 | Exceptional 18.8% |
| Filipinos | 100.0 /100 | #2 | Exceptional 19.0% |
| Immigrants | India | 100.0 /100 | #3 | Exceptional 19.7% |
| Immigrants | Hong Kong | 100.0 /100 | #4 | Exceptional 19.9% |
| Immigrants | Israel | 100.0 /100 | #5 | Exceptional 19.9% |
| Iranians | 100.0 /100 | #6 | Exceptional 19.9% |
| Cypriots | 100.0 /100 | #7 | Exceptional 20.1% |
| Thais | 100.0 /100 | #8 | Exceptional 20.1% |
| Immigrants | China | 100.0 /100 | #9 | Exceptional 20.3% |
| Immigrants | Eastern Asia | 100.0 /100 | #10 | Exceptional 20.3% |
| Immigrants | Ireland | 100.0 /100 | #11 | Exceptional 20.3% |
| Immigrants | Korea | 100.0 /100 | #12 | Exceptional 20.4% |
| Immigrants | Singapore | 100.0 /100 | #13 | Exceptional 20.4% |
| Indians (Asian) | 100.0 /100 | #14 | Exceptional 20.5% |
| Paraguayans | 100.0 /100 | #15 | Exceptional 20.5% |
Demographics Similar to French by Disability Age 65 to 74
In terms of disability age 65 to 74, the demographic groups most similar to French are Immigrants from West Indies (23.9%, a difference of 0.020%), Trinidadian and Tobagonian (23.9%, a difference of 0.070%), Nicaraguan (23.9%, a difference of 0.16%), Immigrants from Oceania (24.0%, a difference of 0.24%), and Pennsylvania German (24.0%, a difference of 0.28%).
| Demographics | Rating | Rank | Disability Age 65 to 74 |
| Tongans | 20.8 /100 | #205 | Fair 23.8% |
| Immigrants | Jamaica | 20.7 /100 | #206 | Fair 23.8% |
| Immigrants | Sudan | 20.1 /100 | #207 | Fair 23.8% |
| Immigrants | Barbados | 19.6 /100 | #208 | Poor 23.8% |
| Immigrants | Kenya | 19.6 /100 | #209 | Poor 23.8% |
| Trinidadians and Tobagonians | 16.4 /100 | #210 | Poor 23.9% |
| Immigrants | West Indies | 15.9 /100 | #211 | Poor 23.9% |
| French | 15.7 /100 | #212 | Poor 23.9% |
| Nicaraguans | 14.3 /100 | #213 | Poor 23.9% |
| Immigrants | Oceania | 13.6 /100 | #214 | Poor 24.0% |
| Pennsylvania Germans | 13.3 /100 | #215 | Poor 24.0% |
| Jamaicans | 12.2 /100 | #216 | Poor 24.0% |
| Immigrants | Portugal | 11.7 /100 | #217 | Poor 24.0% |
| Immigrants | Nigeria | 11.7 /100 | #218 | Poor 24.0% |
| Immigrants | Burma/Myanmar | 11.6 /100 | #219 | Poor 24.0% |