Nigerian vs Cherokee Self-Care Disability
COMPARE
Nigerian
Cherokee
Self-Care Disability
Self-Care Disability Comparison
Nigerians
Cherokee
2.4%
SELF-CARE DISABILITY
70.6/ 100
METRIC RATING
156th/ 347
METRIC RANK
2.9%
SELF-CARE DISABILITY
0.0/ 100
METRIC RATING
324th/ 347
METRIC RANK
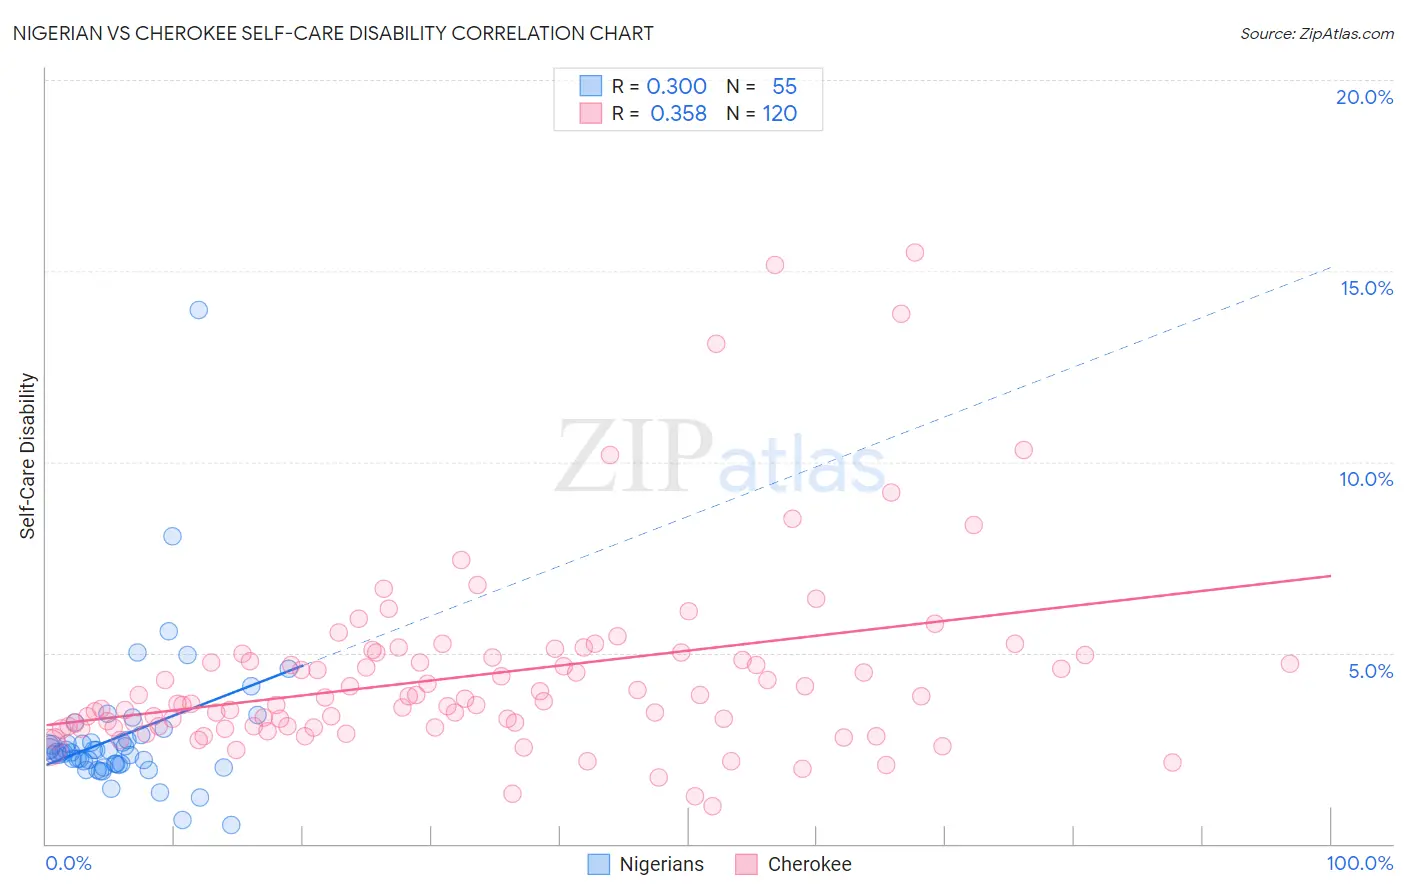
Nigerian vs Cherokee Self-Care Disability Correlation Chart
The statistical analysis conducted on geographies consisting of 332,359,271 people shows a mild positive correlation between the proportion of Nigerians and percentage of population with self-care disability in the United States with a correlation coefficient (R) of 0.300 and weighted average of 2.4%. Similarly, the statistical analysis conducted on geographies consisting of 492,732,584 people shows a mild positive correlation between the proportion of Cherokee and percentage of population with self-care disability in the United States with a correlation coefficient (R) of 0.358 and weighted average of 2.9%, a difference of 17.9%.
Self-Care Disability Correlation Summary
| Measurement | Nigerian | Cherokee |
| Minimum | 0.50% | 0.97% |
| Maximum | 14.0% | 15.5% |
| Range | 13.5% | 14.5% |
| Mean | 2.8% | 4.4% |
| Median | 2.4% | 3.8% |
| Interquartile 25% (IQ1) | 2.1% | 3.1% |
| Interquartile 75% (IQ3) | 2.7% | 4.9% |
| Interquartile Range (IQR) | 0.62% | 1.8% |
| Standard Deviation (Sample) | 1.9% | 2.5% |
| Standard Deviation (Population) | 1.9% | 2.5% |
Similar Demographics by Self-Care Disability
Demographics Similar to Nigerians by Self-Care Disability
In terms of self-care disability, the demographic groups most similar to Nigerians are Pakistani (2.4%, a difference of 0.050%), Immigrants from Europe (2.4%, a difference of 0.060%), Italian (2.4%, a difference of 0.090%), Immigrants from Western Europe (2.4%, a difference of 0.12%), and Immigrants from Italy (2.4%, a difference of 0.12%).
| Demographics | Rating | Rank | Self-Care Disability |
| Arabs | 75.7 /100 | #149 | Good 2.4% |
| Immigrants | Costa Rica | 75.1 /100 | #150 | Good 2.4% |
| Basques | 74.0 /100 | #151 | Good 2.4% |
| Tlingit-Haida | 73.5 /100 | #152 | Good 2.4% |
| Immigrants | England | 73.5 /100 | #153 | Good 2.4% |
| Italians | 72.2 /100 | #154 | Good 2.4% |
| Pakistanis | 71.4 /100 | #155 | Good 2.4% |
| Nigerians | 70.6 /100 | #156 | Good 2.4% |
| Immigrants | Europe | 69.6 /100 | #157 | Good 2.4% |
| Immigrants | Western Europe | 68.6 /100 | #158 | Good 2.4% |
| Immigrants | Italy | 68.5 /100 | #159 | Good 2.4% |
| Finns | 67.0 /100 | #160 | Good 2.4% |
| Lebanese | 66.5 /100 | #161 | Good 2.4% |
| Somalis | 63.7 /100 | #162 | Good 2.5% |
| German Russians | 62.7 /100 | #163 | Good 2.5% |
Demographics Similar to Cherokee by Self-Care Disability
In terms of self-care disability, the demographic groups most similar to Cherokee are Seminole (2.9%, a difference of 0.10%), Comanche (2.9%, a difference of 0.22%), Immigrants from Uzbekistan (2.9%, a difference of 0.53%), Navajo (2.9%, a difference of 0.55%), and Chickasaw (2.9%, a difference of 0.70%).
| Demographics | Rating | Rank | Self-Care Disability |
| Immigrants | Dominica | 0.0 /100 | #317 | Tragic 2.8% |
| Assyrians/Chaldeans/Syriacs | 0.0 /100 | #318 | Tragic 2.8% |
| Spanish American Indians | 0.0 /100 | #319 | Tragic 2.9% |
| Chickasaw | 0.0 /100 | #320 | Tragic 2.9% |
| Navajo | 0.0 /100 | #321 | Tragic 2.9% |
| Comanche | 0.0 /100 | #322 | Tragic 2.9% |
| Seminole | 0.0 /100 | #323 | Tragic 2.9% |
| Cherokee | 0.0 /100 | #324 | Tragic 2.9% |
| Immigrants | Uzbekistan | 0.0 /100 | #325 | Tragic 2.9% |
| Paiute | 0.0 /100 | #326 | Tragic 2.9% |
| Blacks/African Americans | 0.0 /100 | #327 | Tragic 2.9% |
| Hopi | 0.0 /100 | #328 | Tragic 2.9% |
| Cajuns | 0.0 /100 | #329 | Tragic 2.9% |
| Nepalese | 0.0 /100 | #330 | Tragic 3.0% |
| Lumbee | 0.0 /100 | #331 | Tragic 3.0% |