New Zealander vs Croatian Disability Age 18 to 34
COMPARE
New Zealander
Croatian
Disability Age 18 to 34
Disability Age 18 to 34 Comparison
New Zealanders
Croatians
7.0%
DISABILITY AGE 18 TO 34
2.7/ 100
METRIC RATING
233rd/ 347
METRIC RANK
7.2%
DISABILITY AGE 18 TO 34
0.5/ 100
METRIC RATING
253rd/ 347
METRIC RANK
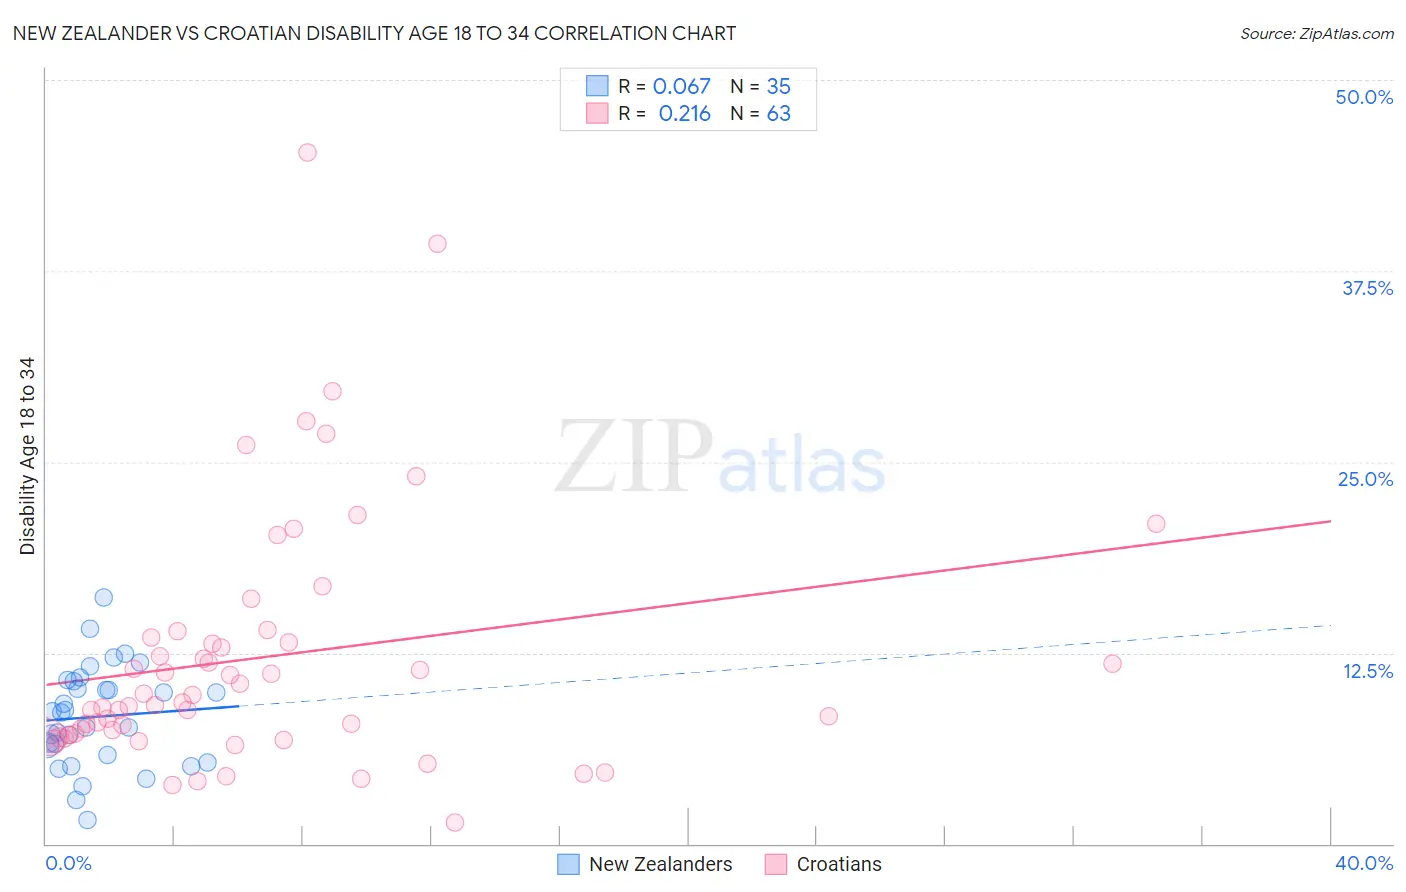
New Zealander vs Croatian Disability Age 18 to 34 Correlation Chart
The statistical analysis conducted on geographies consisting of 106,843,662 people shows a slight positive correlation between the proportion of New Zealanders and percentage of population with a disability between the ages 18 and 35 in the United States with a correlation coefficient (R) of 0.067 and weighted average of 7.0%. Similarly, the statistical analysis conducted on geographies consisting of 374,764,150 people shows a weak positive correlation between the proportion of Croatians and percentage of population with a disability between the ages 18 and 35 in the United States with a correlation coefficient (R) of 0.216 and weighted average of 7.2%, a difference of 2.9%.
Disability Age 18 to 34 Correlation Summary
| Measurement | New Zealander | Croatian |
| Minimum | 1.5% | 1.4% |
| Maximum | 16.1% | 45.2% |
| Range | 14.6% | 43.8% |
| Mean | 8.3% | 12.2% |
| Median | 8.6% | 9.3% |
| Interquartile 25% (IQ1) | 5.8% | 7.1% |
| Interquartile 75% (IQ3) | 10.6% | 13.5% |
| Interquartile Range (IQR) | 4.8% | 6.4% |
| Standard Deviation (Sample) | 3.2% | 8.3% |
| Standard Deviation (Population) | 3.2% | 8.3% |
Demographics Similar to New Zealanders and Croatians by Disability Age 18 to 34
In terms of disability age 18 to 34, the demographic groups most similar to New Zealanders are Alsatian (7.0%, a difference of 0.43%), Subsaharan African (7.1%, a difference of 0.80%), Liberian (7.1%, a difference of 1.1%), Austrian (7.1%, a difference of 1.2%), and Marshallese (7.1%, a difference of 1.3%). Similarly, the demographic groups most similar to Croatians are Polish (7.2%, a difference of 0.27%), Spaniard (7.2%, a difference of 0.28%), Fijian (7.2%, a difference of 0.30%), Malaysian (7.2%, a difference of 0.59%), and Guamanian/Chamorro (7.2%, a difference of 0.69%).
| Demographics | Rating | Rank | Disability Age 18 to 34 |
| New Zealanders | 2.7 /100 | #233 | Tragic 7.0% |
| Alsatians | 2.1 /100 | #234 | Tragic 7.0% |
| Sub-Saharan Africans | 1.7 /100 | #235 | Tragic 7.1% |
| Liberians | 1.5 /100 | #236 | Tragic 7.1% |
| Austrians | 1.3 /100 | #237 | Tragic 7.1% |
| Marshallese | 1.3 /100 | #238 | Tragic 7.1% |
| Italians | 1.2 /100 | #239 | Tragic 7.1% |
| Arapaho | 1.1 /100 | #240 | Tragic 7.1% |
| Nepalese | 1.1 /100 | #241 | Tragic 7.1% |
| Immigrants | Congo | 1.1 /100 | #242 | Tragic 7.1% |
| Icelanders | 1.0 /100 | #243 | Tragic 7.1% |
| Immigrants | Zaire | 0.9 /100 | #244 | Tragic 7.1% |
| Hungarians | 0.9 /100 | #245 | Tragic 7.1% |
| Immigrants | Liberia | 0.8 /100 | #246 | Tragic 7.1% |
| Yugoslavians | 0.8 /100 | #247 | Tragic 7.2% |
| Guamanians/Chamorros | 0.8 /100 | #248 | Tragic 7.2% |
| Malaysians | 0.7 /100 | #249 | Tragic 7.2% |
| Fijians | 0.6 /100 | #250 | Tragic 7.2% |
| Spaniards | 0.6 /100 | #251 | Tragic 7.2% |
| Poles | 0.6 /100 | #252 | Tragic 7.2% |
| Croatians | 0.5 /100 | #253 | Tragic 7.2% |