New Zealander vs Immigrants from Eastern Asia Disability Age 18 to 34
COMPARE
New Zealander
Immigrants from Eastern Asia
Disability Age 18 to 34
Disability Age 18 to 34 Comparison
New Zealanders
Immigrants from Eastern Asia
7.0%
DISABILITY AGE 18 TO 34
2.7/ 100
METRIC RATING
233rd/ 347
METRIC RANK
5.6%
DISABILITY AGE 18 TO 34
100.0/ 100
METRIC RATING
17th/ 347
METRIC RANK
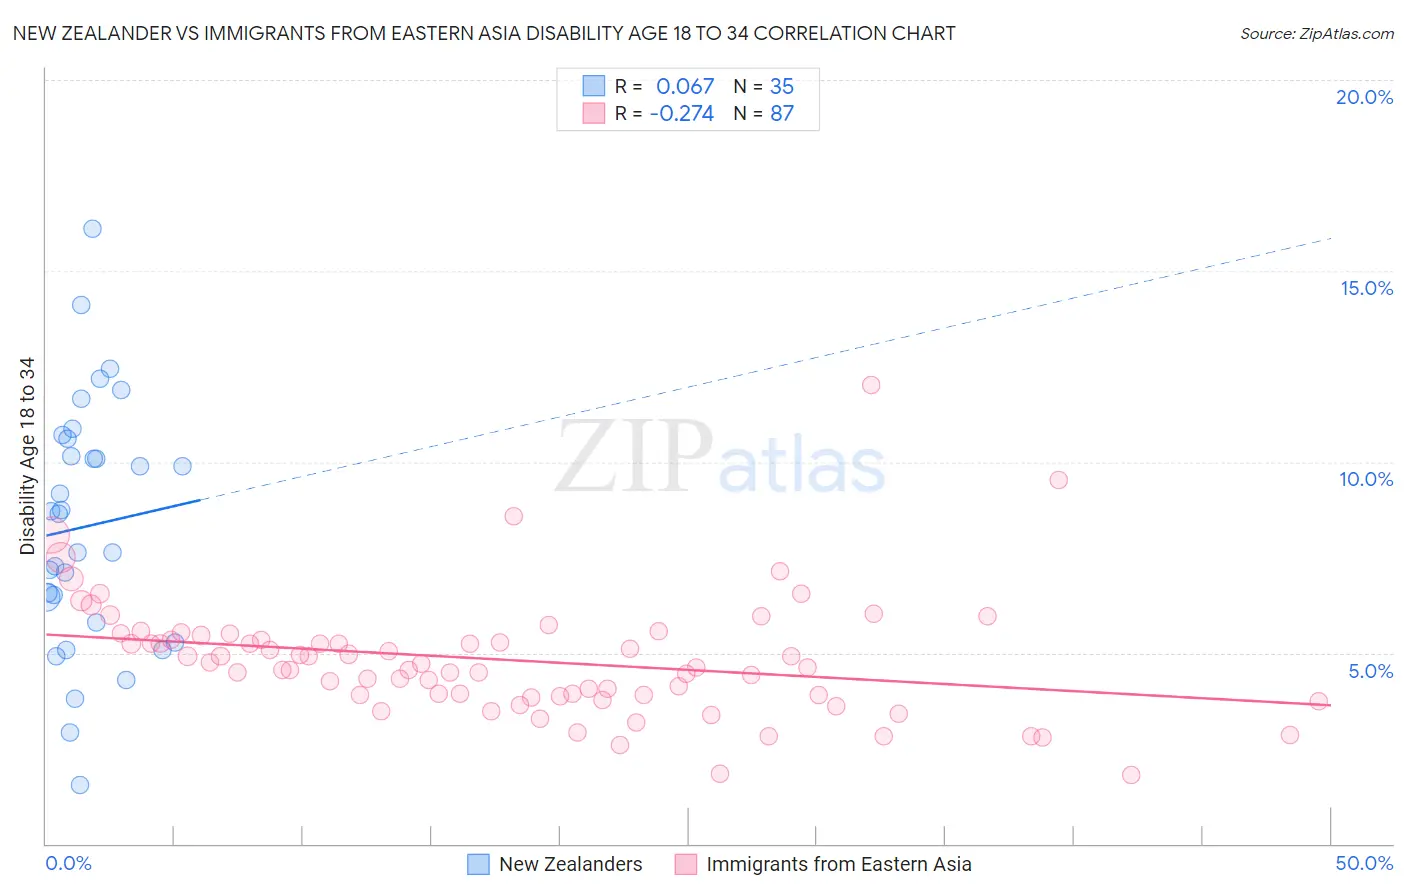
New Zealander vs Immigrants from Eastern Asia Disability Age 18 to 34 Correlation Chart
The statistical analysis conducted on geographies consisting of 106,843,662 people shows a slight positive correlation between the proportion of New Zealanders and percentage of population with a disability between the ages 18 and 35 in the United States with a correlation coefficient (R) of 0.067 and weighted average of 7.0%. Similarly, the statistical analysis conducted on geographies consisting of 498,053,268 people shows a weak negative correlation between the proportion of Immigrants from Eastern Asia and percentage of population with a disability between the ages 18 and 35 in the United States with a correlation coefficient (R) of -0.274 and weighted average of 5.6%, a difference of 25.6%.
Disability Age 18 to 34 Correlation Summary
| Measurement | New Zealander | Immigrants from Eastern Asia |
| Minimum | 1.5% | 1.8% |
| Maximum | 16.1% | 12.0% |
| Range | 14.6% | 10.2% |
| Mean | 8.3% | 4.8% |
| Median | 8.6% | 4.6% |
| Interquartile 25% (IQ1) | 5.8% | 3.9% |
| Interquartile 75% (IQ3) | 10.6% | 5.5% |
| Interquartile Range (IQR) | 4.8% | 1.6% |
| Standard Deviation (Sample) | 3.2% | 1.6% |
| Standard Deviation (Population) | 3.2% | 1.6% |
Similar Demographics by Disability Age 18 to 34
Demographics Similar to New Zealanders by Disability Age 18 to 34
In terms of disability age 18 to 34, the demographic groups most similar to New Zealanders are Samoan (7.0%, a difference of 0.26%), Alsatian (7.0%, a difference of 0.43%), Ute (7.0%, a difference of 0.56%), Immigrants from North America (7.0%, a difference of 0.58%), and Lithuanian (7.0%, a difference of 0.68%).
| Demographics | Rating | Rank | Disability Age 18 to 34 |
| Ugandans | 4.4 /100 | #226 | Tragic 6.9% |
| Immigrants | Canada | 4.3 /100 | #227 | Tragic 7.0% |
| Immigrants | Yemen | 4.2 /100 | #228 | Tragic 7.0% |
| Lithuanians | 4.1 /100 | #229 | Tragic 7.0% |
| Immigrants | North America | 3.9 /100 | #230 | Tragic 7.0% |
| Ute | 3.8 /100 | #231 | Tragic 7.0% |
| Samoans | 3.2 /100 | #232 | Tragic 7.0% |
| New Zealanders | 2.7 /100 | #233 | Tragic 7.0% |
| Alsatians | 2.1 /100 | #234 | Tragic 7.0% |
| Sub-Saharan Africans | 1.7 /100 | #235 | Tragic 7.1% |
| Liberians | 1.5 /100 | #236 | Tragic 7.1% |
| Austrians | 1.3 /100 | #237 | Tragic 7.1% |
| Marshallese | 1.3 /100 | #238 | Tragic 7.1% |
| Italians | 1.2 /100 | #239 | Tragic 7.1% |
| Arapaho | 1.1 /100 | #240 | Tragic 7.1% |
Demographics Similar to Immigrants from Eastern Asia by Disability Age 18 to 34
In terms of disability age 18 to 34, the demographic groups most similar to Immigrants from Eastern Asia are Immigrants from Israel (5.6%, a difference of 0.17%), Immigrants from India (5.6%, a difference of 0.20%), Indian (Asian) (5.5%, a difference of 0.58%), Immigrants from Iran (5.5%, a difference of 0.73%), and Immigrants from Bolivia (5.6%, a difference of 0.76%).
| Demographics | Rating | Rank | Disability Age 18 to 34 |
| Immigrants | Uzbekistan | 100.0 /100 | #10 | Exceptional 5.5% |
| Vietnamese | 100.0 /100 | #11 | Exceptional 5.5% |
| Immigrants | St. Vincent and the Grenadines | 100.0 /100 | #12 | Exceptional 5.5% |
| Immigrants | Iran | 100.0 /100 | #13 | Exceptional 5.5% |
| Indians (Asian) | 100.0 /100 | #14 | Exceptional 5.5% |
| Immigrants | India | 100.0 /100 | #15 | Exceptional 5.6% |
| Immigrants | Israel | 100.0 /100 | #16 | Exceptional 5.6% |
| Immigrants | Eastern Asia | 100.0 /100 | #17 | Exceptional 5.6% |
| Immigrants | Bolivia | 100.0 /100 | #18 | Exceptional 5.6% |
| Thais | 100.0 /100 | #19 | Exceptional 5.6% |
| Immigrants | Bangladesh | 100.0 /100 | #20 | Exceptional 5.6% |
| Immigrants | South Central Asia | 100.0 /100 | #21 | Exceptional 5.7% |
| Immigrants | Nicaragua | 100.0 /100 | #22 | Exceptional 5.7% |
| Cubans | 100.0 /100 | #23 | Exceptional 5.7% |
| Immigrants | Argentina | 100.0 /100 | #24 | Exceptional 5.7% |