Immigrants from Micronesia vs Croatian Disability Age 18 to 34
COMPARE
Immigrants from Micronesia
Croatian
Disability Age 18 to 34
Disability Age 18 to 34 Comparison
Immigrants from Micronesia
Croatians
7.3%
DISABILITY AGE 18 TO 34
0.3/ 100
METRIC RATING
258th/ 347
METRIC RANK
7.2%
DISABILITY AGE 18 TO 34
0.5/ 100
METRIC RATING
253rd/ 347
METRIC RANK
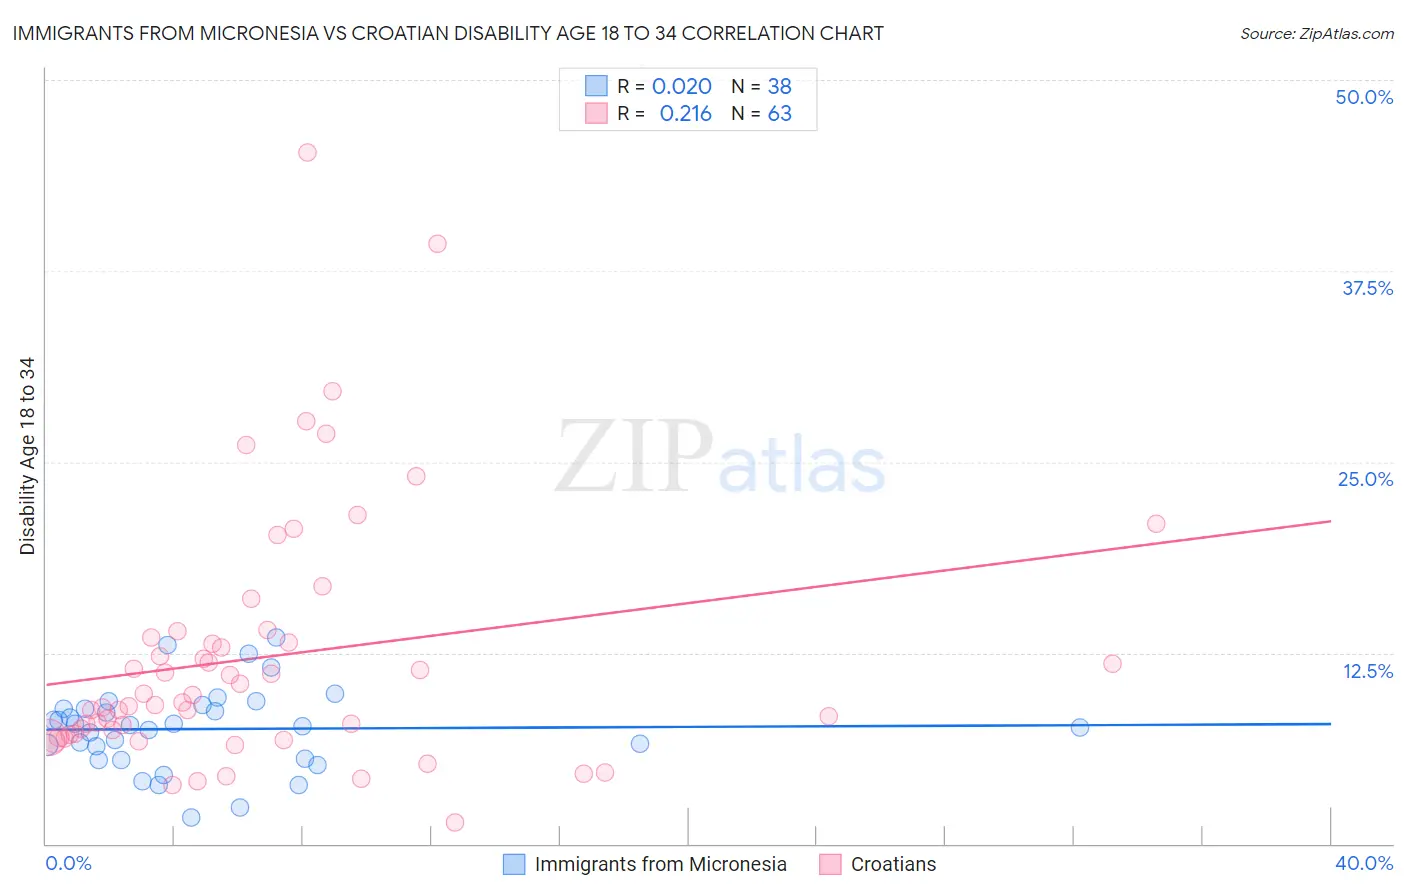
Immigrants from Micronesia vs Croatian Disability Age 18 to 34 Correlation Chart
The statistical analysis conducted on geographies consisting of 61,577,951 people shows no correlation between the proportion of Immigrants from Micronesia and percentage of population with a disability between the ages 18 and 35 in the United States with a correlation coefficient (R) of 0.020 and weighted average of 7.3%. Similarly, the statistical analysis conducted on geographies consisting of 374,764,150 people shows a weak positive correlation between the proportion of Croatians and percentage of population with a disability between the ages 18 and 35 in the United States with a correlation coefficient (R) of 0.216 and weighted average of 7.2%, a difference of 1.1%.
Disability Age 18 to 34 Correlation Summary
| Measurement | Immigrants from Micronesia | Croatian |
| Minimum | 1.7% | 1.4% |
| Maximum | 13.5% | 45.2% |
| Range | 11.8% | 43.8% |
| Mean | 7.5% | 12.2% |
| Median | 7.7% | 9.3% |
| Interquartile 25% (IQ1) | 5.6% | 7.1% |
| Interquartile 75% (IQ3) | 8.8% | 13.5% |
| Interquartile Range (IQR) | 3.3% | 6.4% |
| Standard Deviation (Sample) | 2.7% | 8.3% |
| Standard Deviation (Population) | 2.6% | 8.3% |
Demographics Similar to Immigrants from Micronesia and Croatians by Disability Age 18 to 34
In terms of disability age 18 to 34, the demographic groups most similar to Immigrants from Micronesia are Somali (7.3%, a difference of 0.070%), Tohono O'odham (7.3%, a difference of 0.12%), Northern European (7.3%, a difference of 0.30%), Canadian (7.3%, a difference of 0.33%), and Czech (7.2%, a difference of 0.44%). Similarly, the demographic groups most similar to Croatians are Polish (7.2%, a difference of 0.27%), Spaniard (7.2%, a difference of 0.28%), Indonesian (7.2%, a difference of 0.29%), Fijian (7.2%, a difference of 0.30%), and Immigrants from Germany (7.2%, a difference of 0.31%).
| Demographics | Rating | Rank | Disability Age 18 to 34 |
| Hungarians | 0.9 /100 | #245 | Tragic 7.1% |
| Immigrants | Liberia | 0.8 /100 | #246 | Tragic 7.1% |
| Yugoslavians | 0.8 /100 | #247 | Tragic 7.2% |
| Guamanians/Chamorros | 0.8 /100 | #248 | Tragic 7.2% |
| Malaysians | 0.7 /100 | #249 | Tragic 7.2% |
| Fijians | 0.6 /100 | #250 | Tragic 7.2% |
| Spaniards | 0.6 /100 | #251 | Tragic 7.2% |
| Poles | 0.6 /100 | #252 | Tragic 7.2% |
| Croatians | 0.5 /100 | #253 | Tragic 7.2% |
| Indonesians | 0.4 /100 | #254 | Tragic 7.2% |
| Immigrants | Germany | 0.4 /100 | #255 | Tragic 7.2% |
| Immigrants | Laos | 0.4 /100 | #256 | Tragic 7.2% |
| Czechs | 0.3 /100 | #257 | Tragic 7.2% |
| Immigrants | Micronesia | 0.3 /100 | #258 | Tragic 7.3% |
| Somalis | 0.2 /100 | #259 | Tragic 7.3% |
| Tohono O'odham | 0.2 /100 | #260 | Tragic 7.3% |
| Northern Europeans | 0.2 /100 | #261 | Tragic 7.3% |
| Canadians | 0.2 /100 | #262 | Tragic 7.3% |
| British | 0.2 /100 | #263 | Tragic 7.3% |
| Bermudans | 0.1 /100 | #264 | Tragic 7.3% |
| Slovenes | 0.1 /100 | #265 | Tragic 7.3% |