Navajo vs Paiute Vision Disability
COMPARE
Navajo
Paiute
Vision Disability
Vision Disability Comparison
Navajo
Paiute
3.1%
VISION DISABILITY
0.0/ 100
METRIC RATING
335th/ 347
METRIC RANK
2.9%
VISION DISABILITY
0.0/ 100
METRIC RATING
322nd/ 347
METRIC RANK
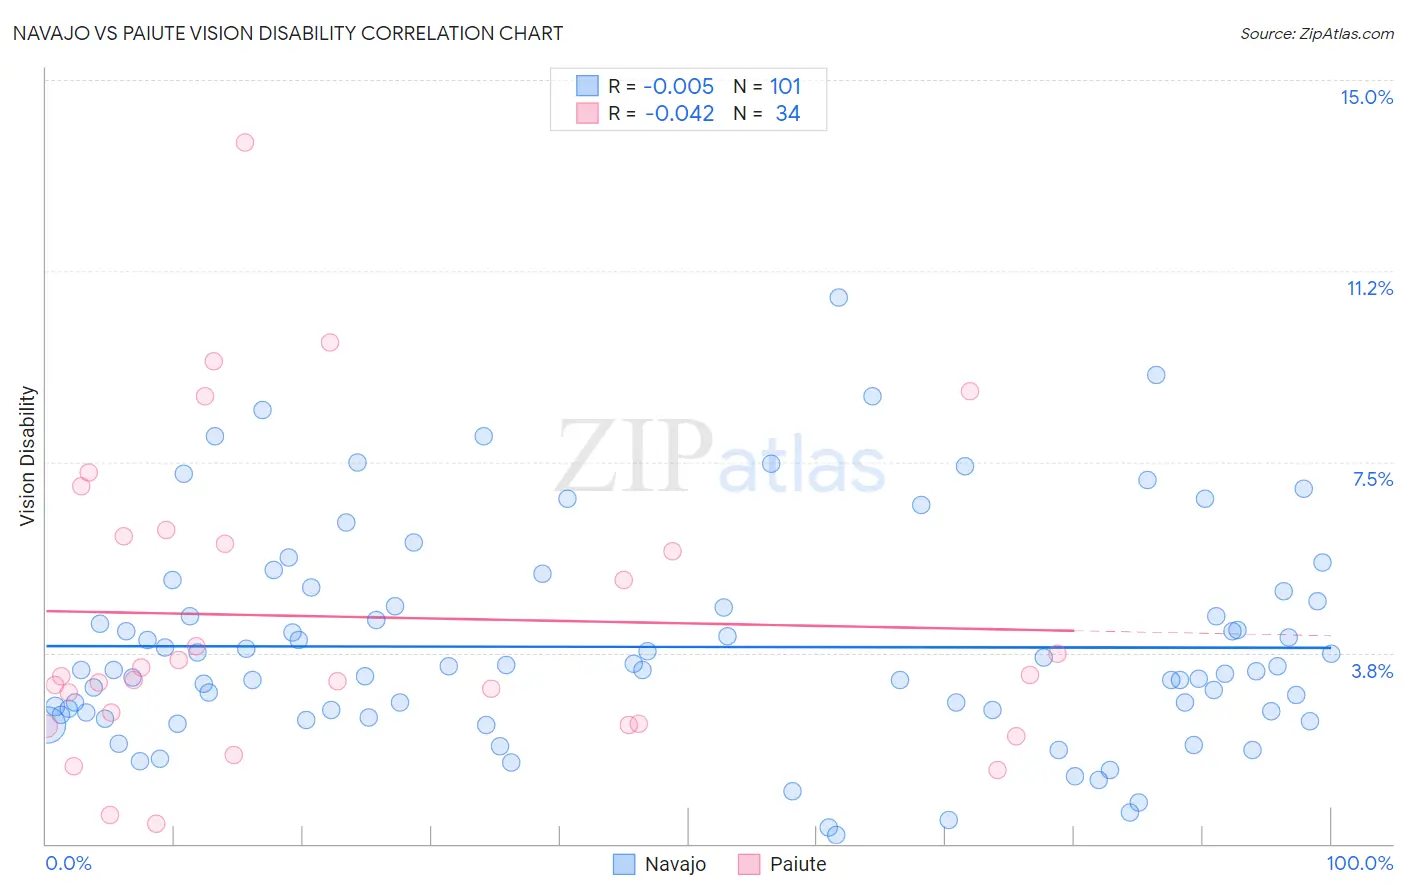
Navajo vs Paiute Vision Disability Correlation Chart
The statistical analysis conducted on geographies consisting of 224,647,940 people shows no correlation between the proportion of Navajo and percentage of population with vision disability in the United States with a correlation coefficient (R) of -0.005 and weighted average of 3.1%. Similarly, the statistical analysis conducted on geographies consisting of 58,384,009 people shows no correlation between the proportion of Paiute and percentage of population with vision disability in the United States with a correlation coefficient (R) of -0.042 and weighted average of 2.9%, a difference of 10.2%.
Vision Disability Correlation Summary
| Measurement | Navajo | Paiute |
| Minimum | 0.16% | 0.39% |
| Maximum | 10.7% | 13.8% |
| Range | 10.6% | 13.4% |
| Mean | 3.9% | 4.5% |
| Median | 3.4% | 3.3% |
| Interquartile 25% (IQ1) | 2.6% | 2.4% |
| Interquartile 75% (IQ3) | 4.7% | 6.0% |
| Interquartile Range (IQR) | 2.2% | 3.7% |
| Standard Deviation (Sample) | 2.1% | 3.0% |
| Standard Deviation (Population) | 2.1% | 3.0% |
Demographics Similar to Navajo and Paiute by Vision Disability
In terms of vision disability, the demographic groups most similar to Navajo are Alaskan Athabascan (3.1%, a difference of 0.16%), Dutch West Indian (3.2%, a difference of 0.19%), Chickasaw (3.2%, a difference of 1.1%), Cheyenne (3.1%, a difference of 1.7%), and Cajun (3.1%, a difference of 2.8%). Similarly, the demographic groups most similar to Paiute are Tlingit-Haida (2.9%, a difference of 0.0%), Comanche (2.8%, a difference of 0.42%), Hopi (2.9%, a difference of 2.0%), Cherokee (2.9%, a difference of 2.0%), and Black/African American (2.8%, a difference of 2.5%).
| Demographics | Rating | Rank | Vision Disability |
| Alaska Natives | 0.0 /100 | #318 | Tragic 2.7% |
| Tohono O'odham | 0.0 /100 | #319 | Tragic 2.8% |
| Blacks/African Americans | 0.0 /100 | #320 | Tragic 2.8% |
| Comanche | 0.0 /100 | #321 | Tragic 2.8% |
| Paiute | 0.0 /100 | #322 | Tragic 2.9% |
| Tlingit-Haida | 0.0 /100 | #323 | Tragic 2.9% |
| Hopi | 0.0 /100 | #324 | Tragic 2.9% |
| Cherokee | 0.0 /100 | #325 | Tragic 2.9% |
| Spanish Americans | 0.0 /100 | #326 | Tragic 2.9% |
| Natives/Alaskans | 0.0 /100 | #327 | Tragic 3.0% |
| Yuman | 0.0 /100 | #328 | Tragic 3.0% |
| Apache | 0.0 /100 | #329 | Tragic 3.0% |
| Colville | 0.0 /100 | #330 | Tragic 3.0% |
| Central American Indians | 0.0 /100 | #331 | Tragic 3.0% |
| Seminole | 0.0 /100 | #332 | Tragic 3.1% |
| Cajuns | 0.0 /100 | #333 | Tragic 3.1% |
| Cheyenne | 0.0 /100 | #334 | Tragic 3.1% |
| Navajo | 0.0 /100 | #335 | Tragic 3.1% |
| Alaskan Athabascans | 0.0 /100 | #336 | Tragic 3.1% |
| Dutch West Indians | 0.0 /100 | #337 | Tragic 3.2% |
| Chickasaw | 0.0 /100 | #338 | Tragic 3.2% |