Mongolian vs Immigrants from Panama Female Disability
COMPARE
Mongolian
Immigrants from Panama
Female Disability
Female Disability Comparison
Mongolians
Immigrants from Panama
11.2%
FEMALE DISABILITY
100.0/ 100
METRIC RATING
40th/ 347
METRIC RANK
12.3%
FEMALE DISABILITY
25.5/ 100
METRIC RATING
196th/ 347
METRIC RANK
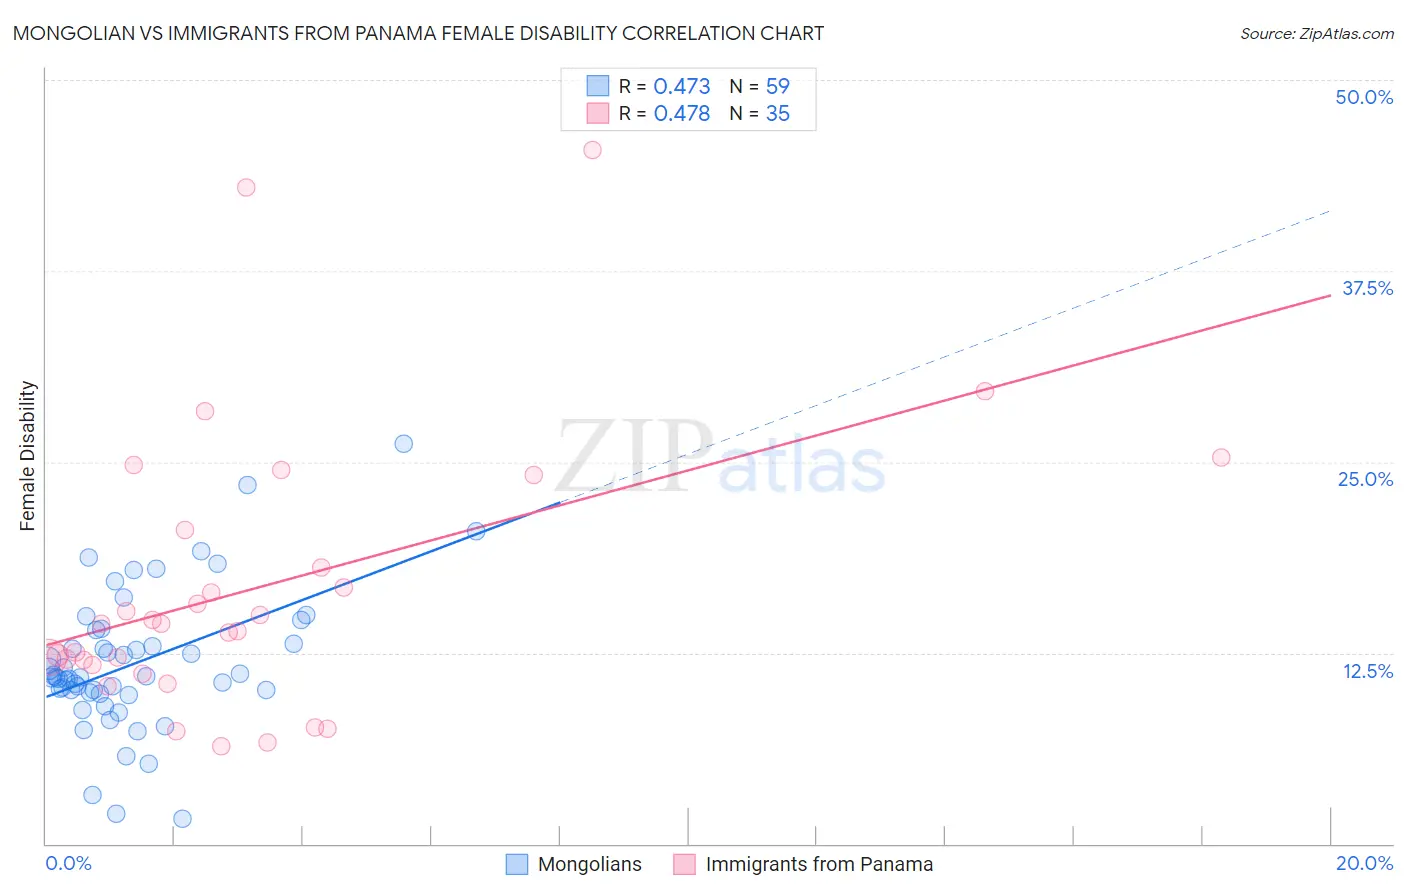
Mongolian vs Immigrants from Panama Female Disability Correlation Chart
The statistical analysis conducted on geographies consisting of 140,358,639 people shows a moderate positive correlation between the proportion of Mongolians and percentage of females with a disability in the United States with a correlation coefficient (R) of 0.473 and weighted average of 11.2%. Similarly, the statistical analysis conducted on geographies consisting of 221,176,996 people shows a moderate positive correlation between the proportion of Immigrants from Panama and percentage of females with a disability in the United States with a correlation coefficient (R) of 0.478 and weighted average of 12.3%, a difference of 9.8%.
Female Disability Correlation Summary
| Measurement | Mongolian | Immigrants from Panama |
| Minimum | 1.6% | 6.4% |
| Maximum | 26.2% | 45.5% |
| Range | 24.6% | 39.1% |
| Mean | 11.8% | 16.8% |
| Median | 10.9% | 14.4% |
| Interquartile 25% (IQ1) | 9.9% | 11.7% |
| Interquartile 75% (IQ3) | 14.0% | 20.5% |
| Interquartile Range (IQR) | 4.1% | 8.8% |
| Standard Deviation (Sample) | 4.6% | 9.1% |
| Standard Deviation (Population) | 4.6% | 9.0% |
Similar Demographics by Female Disability
Demographics Similar to Mongolians by Female Disability
In terms of female disability, the demographic groups most similar to Mongolians are Paraguayan (11.2%, a difference of 0.020%), Immigrants from Lithuania (11.2%, a difference of 0.030%), Israeli (11.2%, a difference of 0.11%), Afghan (11.2%, a difference of 0.14%), and Immigrants from Ethiopia (11.2%, a difference of 0.24%).
| Demographics | Rating | Rank | Female Disability |
| Immigrants | Egypt | 100.0 /100 | #33 | Exceptional 11.1% |
| Immigrants | Indonesia | 100.0 /100 | #34 | Exceptional 11.2% |
| Immigrants | Japan | 100.0 /100 | #35 | Exceptional 11.2% |
| Cypriots | 100.0 /100 | #36 | Exceptional 11.2% |
| Ethiopians | 100.0 /100 | #37 | Exceptional 11.2% |
| Immigrants | Ethiopia | 100.0 /100 | #38 | Exceptional 11.2% |
| Immigrants | Lithuania | 100.0 /100 | #39 | Exceptional 11.2% |
| Mongolians | 100.0 /100 | #40 | Exceptional 11.2% |
| Paraguayans | 100.0 /100 | #41 | Exceptional 11.2% |
| Israelis | 100.0 /100 | #42 | Exceptional 11.2% |
| Afghans | 100.0 /100 | #43 | Exceptional 11.2% |
| Cambodians | 100.0 /100 | #44 | Exceptional 11.3% |
| Immigrants | Sweden | 100.0 /100 | #45 | Exceptional 11.3% |
| Immigrants | Nepal | 100.0 /100 | #46 | Exceptional 11.3% |
| Jordanians | 100.0 /100 | #47 | Exceptional 11.3% |
Demographics Similar to Immigrants from Panama by Female Disability
In terms of female disability, the demographic groups most similar to Immigrants from Panama are Honduran (12.3%, a difference of 0.0%), Mexican American Indian (12.3%, a difference of 0.030%), Immigrants from Trinidad and Tobago (12.3%, a difference of 0.040%), Swedish (12.3%, a difference of 0.060%), and Ukrainian (12.3%, a difference of 0.080%).
| Demographics | Rating | Rank | Female Disability |
| Immigrants | Albania | 31.6 /100 | #189 | Fair 12.3% |
| Immigrants | Honduras | 31.3 /100 | #190 | Fair 12.3% |
| Armenians | 29.7 /100 | #191 | Fair 12.3% |
| Immigrants | Western Africa | 29.2 /100 | #192 | Fair 12.3% |
| Northern Europeans | 27.5 /100 | #193 | Fair 12.3% |
| Ukrainians | 27.2 /100 | #194 | Fair 12.3% |
| Swedes | 26.6 /100 | #195 | Fair 12.3% |
| Immigrants | Panama | 25.5 /100 | #196 | Fair 12.3% |
| Hondurans | 25.4 /100 | #197 | Fair 12.3% |
| Mexican American Indians | 24.9 /100 | #198 | Fair 12.3% |
| Immigrants | Trinidad and Tobago | 24.7 /100 | #199 | Fair 12.3% |
| Trinidadians and Tobagonians | 22.4 /100 | #200 | Fair 12.3% |
| Chinese | 22.1 /100 | #201 | Fair 12.3% |
| Somalis | 21.5 /100 | #202 | Fair 12.3% |
| Immigrants | Barbados | 21.1 /100 | #203 | Fair 12.3% |