Mexican American Indian vs Immigrants from Nepal Disability Age 65 to 74

COMPARE

Mexican American Indian
Race
Ancestry
AfghanAfricanAlaska NativeAlaskan AthabascanAlbanianAleutAlsatianAmericanApacheArabArapahoArgentineanArmenianAssyrian/Chaldean/SyriacAustralianAustrianBahamianBangladeshiBarbadianBasqueBelgianBelizeanBermudanBhutaneseBlackfeetBolivianBrazilianBritishBritish West IndianBulgarianBurmeseCajunCambodianCanadianCape VerdeanCarpatho RusynCelticCentral AmericanCentral American IndianCherokeeCheyenneChickasawChileanChineseChippewaChoctawColombianColvilleComancheCosta RicanCreeCreekCroatianCrowCubanCypriotCzechCzechoslovakianDanishDelawareDominicanDutchDutch West IndianEastern EuropeanEcuadorianEgyptianEnglishEstonianEthiopianEuropeanFijianFilipinoFinnishFrenchFrench American IndianFrench CanadianGermanGerman RussianGhanaianGreekGuamanian/ChamorroGuatemalanGuyaneseHaitianHmongHonduranHopiHoumaHungarianIcelanderIndian (Asian)IndonesianInupiatIranianIraqiIrishIroquoisIsraeliItalianJamaicanJapaneseJordanianKenyanKiowaKoreanLaotianLatvianLebaneseLiberianLithuanianLumbeeLuxembourgerMacedonianMalaysianMalteseMarshalleseMenomineeMexicanMexican American IndianMongolianMoroccanNative HawaiianNavajoNepaleseNew ZealanderNicaraguanNigerianNorthern EuropeanNorwegianOkinawanOsageOttawaPaiutePakistaniPalestinianPanamanianParaguayanPennsylvania GermanPeruvianPimaPolishPortuguesePotawatomiPuebloPuerto RicanPuget Sound SalishRomanianRussianSalvadoranSamoanScandinavianScotch-IrishScottishSeminoleSenegaleseSerbianShoshoneSierra LeoneanSiouxSlavicSlovakSloveneSomaliSouth AfricanSouth AmericanSouth American IndianSoviet UnionSpaniardSpanishSpanish AmericanSpanish American IndianSri LankanSubsaharan AfricanSudaneseSwedishSwissSyrianTaiwaneseThaiTlingit-HaidaTohono O'OdhamTonganTrinidadian and TobagonianTsimshianTurkishU.S. Virgin IslanderUgandanUkrainianUruguayanUteVenezuelanVietnameseWelshWest IndianYakamaYaquiYugoslavianYumanYup'ikZimbabwean
Immigration
NonimmigrantsImmigrantsAfghanistanAfricaAlbaniaArgentinaArmeniaAsiaAustraliaAustriaBahamasBangladeshBarbadosBelarusBelgiumBelizeBoliviaBosnia and HerzegovinaBrazilBulgariaBurma/MyanmarCabo VerdeCambodiaCameroonCanadaCaribbeanCentral AmericaChileChinaColombiaCongoCosta RicaCroatiaCubaCzechoslovakiaDenmarkDominicaDominican RepublicEastern AfricaEastern AsiaEastern EuropeEcuadorEgyptEl SalvadorEnglandEritreaEthiopiaEuropeFijiFranceGermanyGhanaGreeceGrenadaGuatemalaGuyanaHaitiHondurasHong KongHungaryIndiaIndonesiaIranIraqIrelandIsraelItalyJamaicaJapanJordanKazakhstanKenyaKoreaKuwaitLaosLatin AmericaLatviaLebanonLiberiaLithuaniaMalaysiaMexicoMicronesiaMiddle AfricaMoldovaMoroccoNetherlandsNicaraguaNigeriaNorth AmericaNorth MacedoniaNorthern AfricaNorthern EuropeNorwayOceaniaPakistanPanamaPeruPhilippinesPolandPortugalRomaniaRussiaSaudi ArabiaScotlandSenegalSerbiaSierra LeoneSingaporeSomaliaSouth AfricaSouth AmericaSouth Central AsiaSouth Eastern AsiaSouthern EuropeSpainSri LankaSt. Vincent and the GrenadinesSudanSwedenSwitzerlandSyriaTaiwanThailandTrinidad and TobagoTurkeyUgandaUkraineUruguayUzbekistanVenezuelaVietnamWest IndiesWestern AfricaWestern AsiaWestern EuropeYemenZaireZimbabweAzores
Immigrants from Nepal
Race
Ancestry
AfghanAfricanAlaska NativeAlaskan AthabascanAlbanianAleutAlsatianAmericanApacheArabArapahoArgentineanArmenianAssyrian/Chaldean/SyriacAustralianAustrianBahamianBangladeshiBarbadianBasqueBelgianBelizeanBermudanBhutaneseBlackfeetBolivianBrazilianBritishBritish West IndianBulgarianBurmeseCajunCambodianCanadianCape VerdeanCarpatho RusynCelticCentral AmericanCentral American IndianCherokeeCheyenneChickasawChileanChineseChippewaChoctawColombianColvilleComancheCosta RicanCreeCreekCroatianCrowCubanCypriotCzechCzechoslovakianDanishDelawareDominicanDutchDutch West IndianEastern EuropeanEcuadorianEgyptianEnglishEstonianEthiopianEuropeanFijianFilipinoFinnishFrenchFrench American IndianFrench CanadianGermanGerman RussianGhanaianGreekGuamanian/ChamorroGuatemalanGuyaneseHaitianHmongHonduranHopiHoumaHungarianIcelanderIndian (Asian)IndonesianInupiatIranianIraqiIrishIroquoisIsraeliItalianJamaicanJapaneseJordanianKenyanKiowaKoreanLaotianLatvianLebaneseLiberianLithuanianLumbeeLuxembourgerMacedonianMalaysianMalteseMarshalleseMenomineeMexicanMongolianMoroccanNative HawaiianNavajoNepaleseNew ZealanderNicaraguanNigerianNorthern EuropeanNorwegianOkinawanOsageOttawaPaiutePakistaniPalestinianPanamanianParaguayanPennsylvania GermanPeruvianPimaPolishPortuguesePotawatomiPuebloPuerto RicanPuget Sound SalishRomanianRussianSalvadoranSamoanScandinavianScotch-IrishScottishSeminoleSenegaleseSerbianShoshoneSierra LeoneanSiouxSlavicSlovakSloveneSomaliSouth AfricanSouth AmericanSouth American IndianSoviet UnionSpaniardSpanishSpanish AmericanSpanish American IndianSri LankanSubsaharan AfricanSudaneseSwedishSwissSyrianTaiwaneseThaiTlingit-HaidaTohono O'OdhamTonganTrinidadian and TobagonianTsimshianTurkishU.S. Virgin IslanderUgandanUkrainianUruguayanUteVenezuelanVietnameseWelshWest IndianYakamaYaquiYugoslavianYumanYup'ikZimbabwean
Immigration
NonimmigrantsImmigrantsAfghanistanAfricaAlbaniaArgentinaArmeniaAsiaAustraliaAustriaBahamasBangladeshBarbadosBelarusBelgiumBelizeBoliviaBosnia and HerzegovinaBrazilBulgariaBurma/MyanmarCabo VerdeCambodiaCameroonCanadaCaribbeanCentral AmericaChileChinaColombiaCongoCosta RicaCroatiaCubaCzechoslovakiaDenmarkDominicaDominican RepublicEastern AfricaEastern AsiaEastern EuropeEcuadorEgyptEl SalvadorEnglandEritreaEthiopiaEuropeFijiFranceGermanyGhanaGreeceGrenadaGuatemalaGuyanaHaitiHondurasHong KongHungaryIndiaIndonesiaIranIraqIrelandIsraelItalyJamaicaJapanJordanKazakhstanKenyaKoreaKuwaitLaosLatin AmericaLatviaLebanonLiberiaLithuaniaMalaysiaMexicoMicronesiaMiddle AfricaMoldovaMoroccoNepalNetherlandsNicaraguaNigeriaNorth AmericaNorth MacedoniaNorthern AfricaNorthern EuropeNorwayOceaniaPakistanPanamaPeruPhilippinesPolandPortugalRomaniaRussiaSaudi ArabiaScotlandSenegalSerbiaSierra LeoneSingaporeSomaliaSouth AfricaSouth AmericaSouth Central AsiaSouth Eastern AsiaSouthern EuropeSpainSri LankaSt. Vincent and the GrenadinesSudanSwedenSwitzerlandSyriaTaiwanThailandTrinidad and TobagoTurkeyUgandaUkraineUruguayUzbekistanVenezuelaVietnamWest IndiesWestern AfricaWestern AsiaWestern EuropeYemenZaireZimbabweAzores
Disability Age 65 to 74
Income
Poverty
Unemployment
Labor Participation
Family Structure
Vehicle Availability
Education Level
Disability

Disability Age 65 to 74 Comparison

Mexican American Indians

Immigrants from Nepal

Tragic
Excellent
26.2%
DISABILITY AGE 65 TO 74
0.0/ 100
METRIC RATING
288th/ 347
METRIC RANK
22.6%
DISABILITY AGE 65 TO 74
89.4/ 100
METRIC RATING
131st/ 347
METRIC RANK

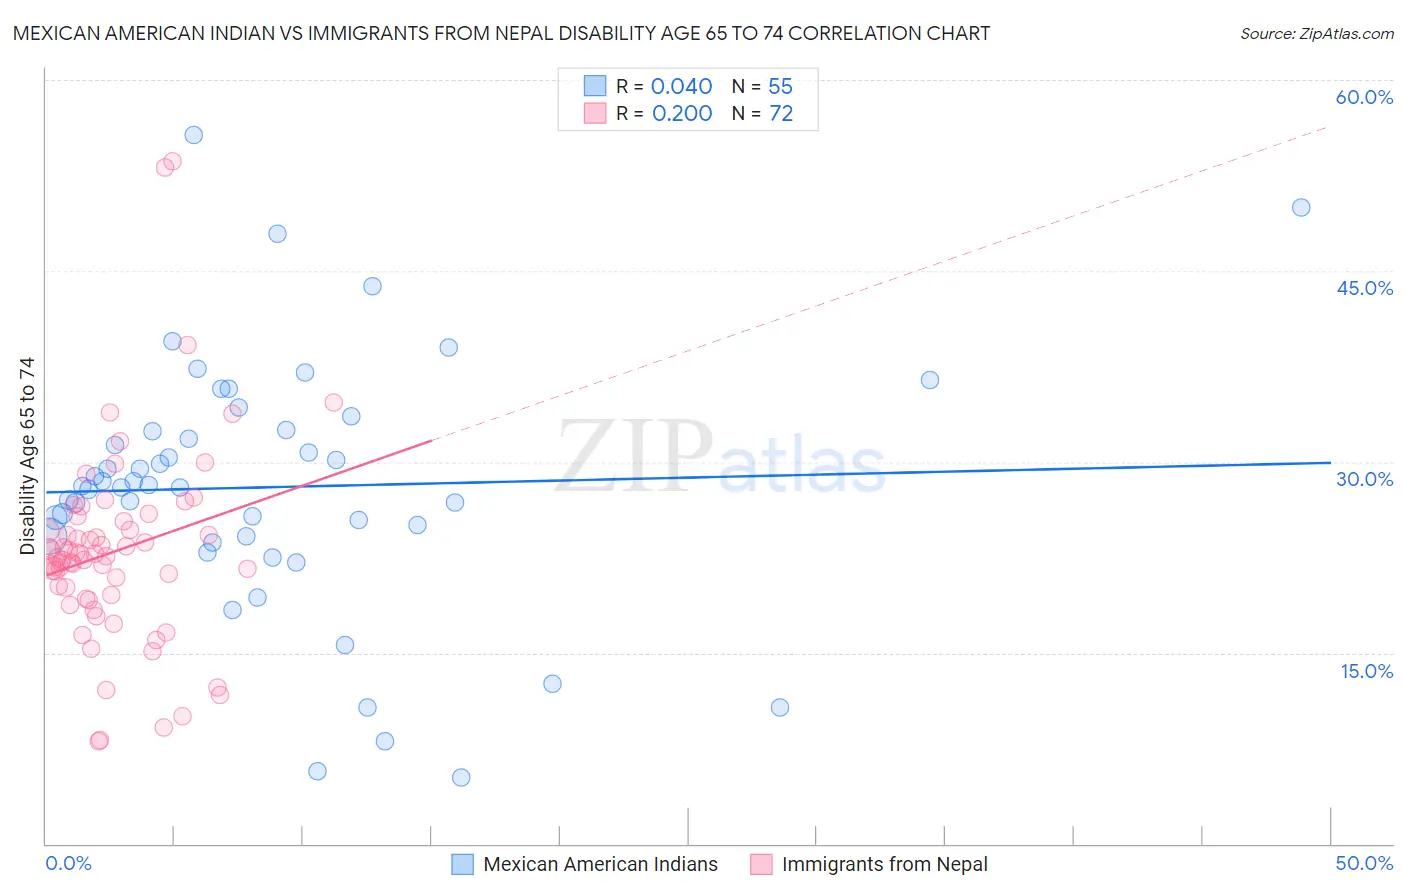
Mexican American Indian vs Immigrants from Nepal Disability Age 65 to 74 Correlation Chart

The statistical analysis conducted on geographies consisting of 317,155,514 people shows no correlation between the proportion of Mexican American Indians and percentage of population with a disability between the ages 65 and 75 in the United States with a correlation coefficient (R) of 0.040 and weighted average of 26.2%. Similarly, the statistical analysis conducted on geographies consisting of 186,541,016 people shows a weak positive correlation between the proportion of Immigrants from Nepal and percentage of population with a disability between the ages 65 and 75 in the United States with a correlation coefficient (R) of 0.200 and weighted average of 22.6%, a difference of 15.7%.
Mexican American Indian vs Immigrants from Nepal Disability Age 65 to 74

Disability Age 65 to 74 Correlation Summary

MeasurementMexican American IndianImmigrants from Nepal
Minimum5.2%8.0%
Maximum55.7%53.6%
Range50.5%45.6%
Mean28.0%22.9%
Median28.1%22.6%
Interquartile 25% (IQ1)24.2%19.4%
Interquartile 75% (IQ3)32.5%25.0%
Interquartile Range (IQR)8.3%5.6%
Standard Deviation (Sample)10.0%7.9%
Standard Deviation (Population)9.9%7.8%

Similar Demographics by Disability Age 65 to 74

Demographics Similar to Mexican American Indians by Disability Age 65 to 74

In terms of disability age 65 to 74, the demographic groups most similar to Mexican American Indians are Immigrants from Laos (26.1%, a difference of 0.10%), Immigrants from Micronesia (26.1%, a difference of 0.16%), African (26.2%, a difference of 0.32%), Immigrants from Congo (26.0%, a difference of 0.59%), and Immigrants from the Azores (26.0%, a difference of 0.61%).
DemographicsRating | RankDisability Age 65 to 74
Immigrants | Honduras
0.1
/100
|
#281
Tragic
25.9%
Delaware
0.1
/100
|
#282
Tragic
25.9%
Spanish Americans
0.0
/100
|
#283
Tragic
25.9%
Immigrants | Azores
0.0
/100
|
#284
Tragic
26.0%
Immigrants | Congo
0.0
/100
|
#285
Tragic
26.0%
Immigrants | Micronesia
0.0
/100
|
#286
Tragic
26.1%
Immigrants | Laos
0.0
/100
|
#287
Tragic
26.1%
Mexican American Indians
0.0
/100
|
#288
Tragic
26.2%
Africans
0.0
/100
|
#289
Tragic
26.2%
Immigrants | Cabo Verde
0.0
/100
|
#290
Tragic
26.3%
Spanish American Indians
0.0
/100
|
#291
Tragic
26.4%
Blackfeet
0.0
/100
|
#292
Tragic
26.6%
Immigrants | Central America
0.0
/100
|
#293
Tragic
26.6%
Dominicans
0.0
/100
|
#294
Tragic
26.7%
Hispanics or Latinos
0.0
/100
|
#295
Tragic
26.7%

Demographics Similar to Immigrants from Nepal by Disability Age 65 to 74

In terms of disability age 65 to 74, the demographic groups most similar to Immigrants from Nepal are Costa Rican (22.6%, a difference of 0.040%), Northern European (22.6%, a difference of 0.080%), Immigrants from Albania (22.6%, a difference of 0.090%), Immigrants from Uruguay (22.6%, a difference of 0.10%), and Afghan (22.6%, a difference of 0.13%).
DemographicsRating | RankDisability Age 65 to 74
Norwegians
92.5
/100
|
#124
Exceptional
22.5%
Immigrants | Western Europe
92.3
/100
|
#125
Exceptional
22.5%
Lebanese
92.2
/100
|
#126
Exceptional
22.5%
Slovaks
91.6
/100
|
#127
Exceptional
22.5%
Immigrants | Costa Rica
90.4
/100
|
#128
Exceptional
22.6%
Immigrants | Uruguay
90.1
/100
|
#129
Exceptional
22.6%
Immigrants | Albania
90.0
/100
|
#130
Excellent
22.6%
Immigrants | Nepal
89.4
/100
|
#131
Excellent
22.6%
Costa Ricans
89.2
/100
|
#132
Excellent
22.6%
Northern Europeans
88.9
/100
|
#133
Excellent
22.6%
Afghans
88.6
/100
|
#134
Excellent
22.6%
Immigrants | Ukraine
88.4
/100
|
#135
Excellent
22.6%
Ethiopians
87.9
/100
|
#136
Excellent
22.7%
Taiwanese
87.6
/100
|
#137
Excellent
22.7%
Immigrants | Moldova
87.3
/100
|
#138
Excellent
22.7%