Menominee vs Immigrants from Serbia Disability Age 65 to 74
COMPARE
Menominee
Immigrants from Serbia
Disability Age 65 to 74
Disability Age 65 to 74 Comparison
Menominee
Immigrants from Serbia
27.4%
DISABILITY AGE 65 TO 74
0.0/ 100
METRIC RATING
311th/ 347
METRIC RANK
21.4%
DISABILITY AGE 65 TO 74
99.6/ 100
METRIC RATING
51st/ 347
METRIC RANK
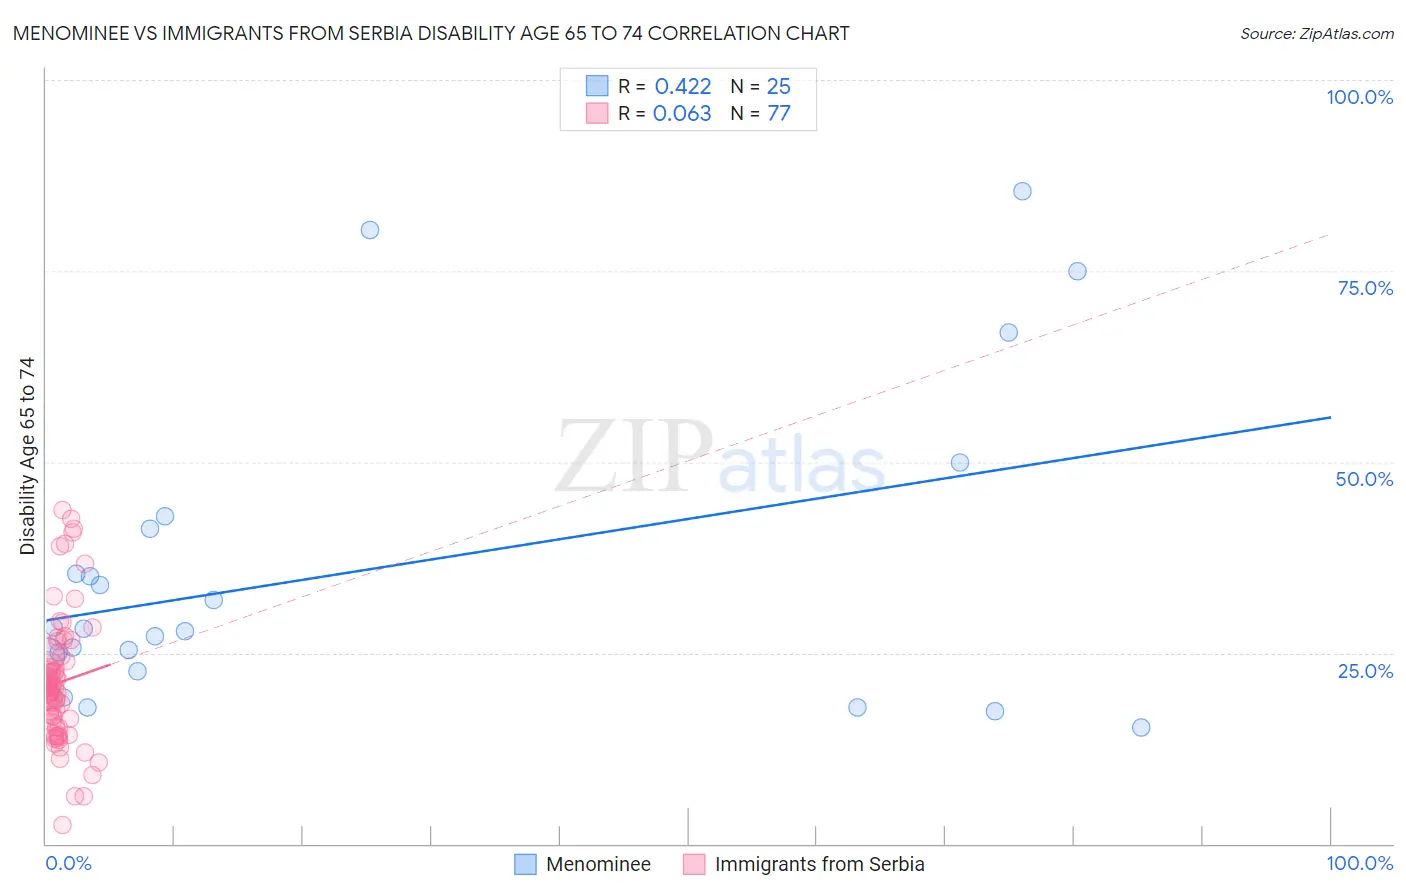
Menominee vs Immigrants from Serbia Disability Age 65 to 74 Correlation Chart
The statistical analysis conducted on geographies consisting of 45,777,170 people shows a moderate positive correlation between the proportion of Menominee and percentage of population with a disability between the ages 65 and 75 in the United States with a correlation coefficient (R) of 0.422 and weighted average of 27.4%. Similarly, the statistical analysis conducted on geographies consisting of 131,669,066 people shows a slight positive correlation between the proportion of Immigrants from Serbia and percentage of population with a disability between the ages 65 and 75 in the United States with a correlation coefficient (R) of 0.063 and weighted average of 21.4%, a difference of 28.0%.
Disability Age 65 to 74 Correlation Summary
| Measurement | Menominee | Immigrants from Serbia |
| Minimum | 15.2% | 2.5% |
| Maximum | 85.4% | 43.7% |
| Range | 70.3% | 41.3% |
| Mean | 36.0% | 21.1% |
| Median | 28.1% | 20.0% |
| Interquartile 25% (IQ1) | 23.6% | 15.6% |
| Interquartile 75% (IQ3) | 42.1% | 24.2% |
| Interquartile Range (IQR) | 18.5% | 8.6% |
| Standard Deviation (Sample) | 20.2% | 8.4% |
| Standard Deviation (Population) | 19.8% | 8.3% |
Similar Demographics by Disability Age 65 to 74
Demographics Similar to Menominee by Disability Age 65 to 74
In terms of disability age 65 to 74, the demographic groups most similar to Menominee are Osage (27.5%, a difference of 0.080%), Shoshone (27.4%, a difference of 0.23%), Yaqui (27.4%, a difference of 0.27%), Sioux (27.3%, a difference of 0.34%), and Ute (27.3%, a difference of 0.49%).
| Demographics | Rating | Rank | Disability Age 65 to 74 |
| Puget Sound Salish | 0.0 /100 | #304 | Tragic 27.2% |
| Mexicans | 0.0 /100 | #305 | Tragic 27.2% |
| Blacks/African Americans | 0.0 /100 | #306 | Tragic 27.3% |
| Ute | 0.0 /100 | #307 | Tragic 27.3% |
| Sioux | 0.0 /100 | #308 | Tragic 27.3% |
| Yaqui | 0.0 /100 | #309 | Tragic 27.4% |
| Shoshone | 0.0 /100 | #310 | Tragic 27.4% |
| Menominee | 0.0 /100 | #311 | Tragic 27.4% |
| Osage | 0.0 /100 | #312 | Tragic 27.5% |
| Paiute | 0.0 /100 | #313 | Tragic 27.8% |
| Chippewa | 0.0 /100 | #314 | Tragic 27.8% |
| Cajuns | 0.0 /100 | #315 | Tragic 27.9% |
| Crow | 0.0 /100 | #316 | Tragic 27.9% |
| Immigrants | Armenia | 0.0 /100 | #317 | Tragic 28.0% |
| Nepalese | 0.0 /100 | #318 | Tragic 28.0% |
Demographics Similar to Immigrants from Serbia by Disability Age 65 to 74
In terms of disability age 65 to 74, the demographic groups most similar to Immigrants from Serbia are Immigrants from Malaysia (21.4%, a difference of 0.22%), Immigrants from France (21.5%, a difference of 0.22%), Bhutanese (21.5%, a difference of 0.23%), Immigrants from Italy (21.5%, a difference of 0.24%), and Luxembourger (21.4%, a difference of 0.25%).
| Demographics | Rating | Rank | Disability Age 65 to 74 |
| Estonians | 99.7 /100 | #44 | Exceptional 21.4% |
| Asians | 99.7 /100 | #45 | Exceptional 21.4% |
| Immigrants | Turkey | 99.7 /100 | #46 | Exceptional 21.4% |
| Immigrants | Bulgaria | 99.7 /100 | #47 | Exceptional 21.4% |
| Lithuanians | 99.7 /100 | #48 | Exceptional 21.4% |
| Luxembourgers | 99.7 /100 | #49 | Exceptional 21.4% |
| Immigrants | Malaysia | 99.7 /100 | #50 | Exceptional 21.4% |
| Immigrants | Serbia | 99.6 /100 | #51 | Exceptional 21.4% |
| Immigrants | France | 99.6 /100 | #52 | Exceptional 21.5% |
| Bhutanese | 99.6 /100 | #53 | Exceptional 21.5% |
| Immigrants | Italy | 99.6 /100 | #54 | Exceptional 21.5% |
| Immigrants | Romania | 99.5 /100 | #55 | Exceptional 21.5% |
| Immigrants | Denmark | 99.5 /100 | #56 | Exceptional 21.5% |
| Immigrants | Asia | 99.5 /100 | #57 | Exceptional 21.5% |
| Immigrants | Pakistan | 99.5 /100 | #58 | Exceptional 21.5% |