Marshallese vs Central American Indian Disability Age 35 to 64
COMPARE
Marshallese
Central American Indian
Disability Age 35 to 64
Disability Age 35 to 64 Comparison
Marshallese
Central American Indians
12.5%
DISABILITY AGE 35 TO 64
0.4/ 100
METRIC RATING
265th/ 347
METRIC RANK
13.0%
DISABILITY AGE 35 TO 64
0.0/ 100
METRIC RATING
283rd/ 347
METRIC RANK
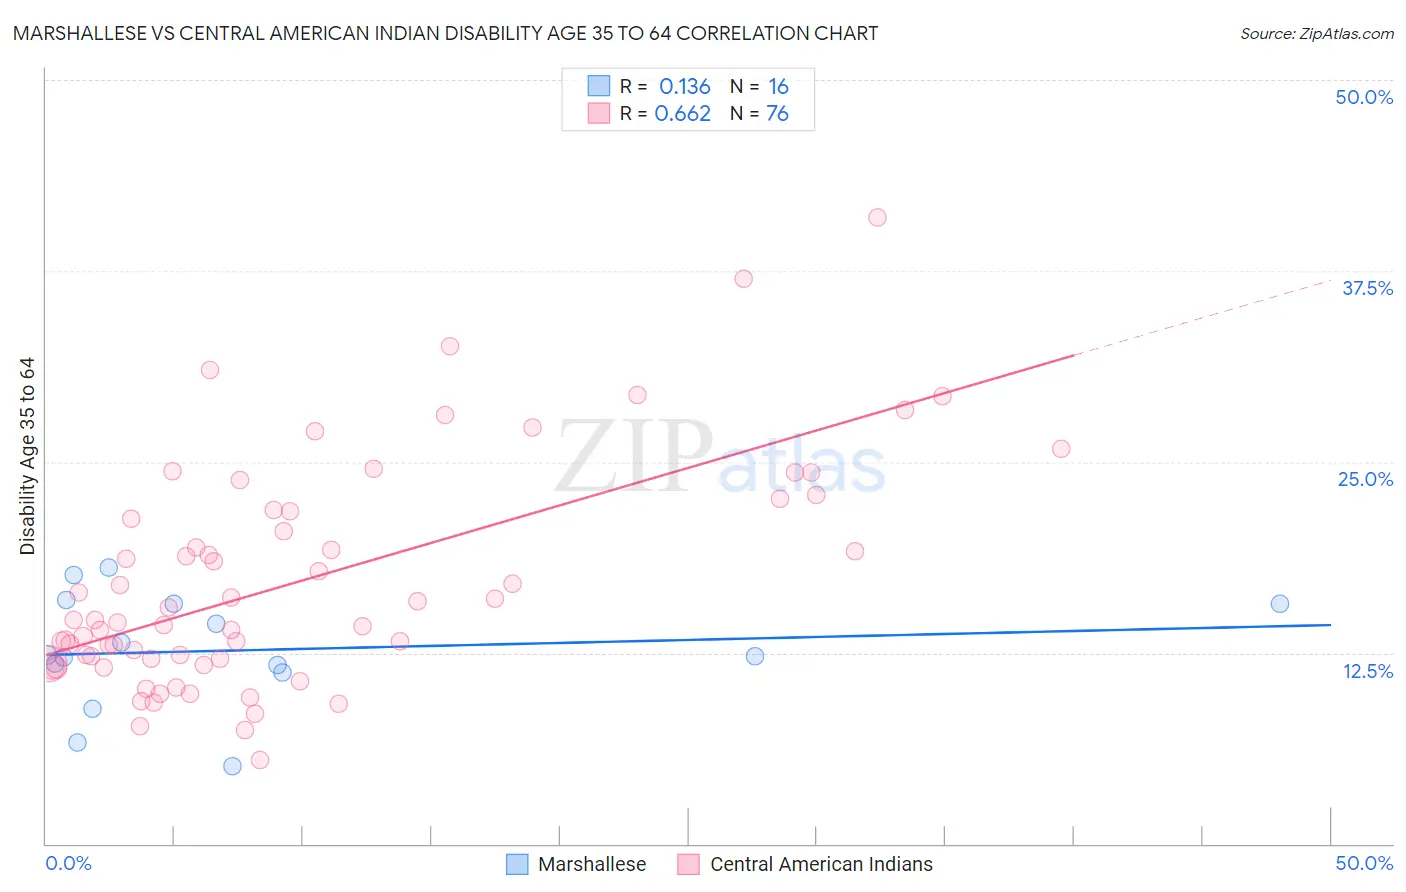
Marshallese vs Central American Indian Disability Age 35 to 64 Correlation Chart
The statistical analysis conducted on geographies consisting of 14,761,315 people shows a poor positive correlation between the proportion of Marshallese and percentage of population with a disability between the ages 34 and 64 in the United States with a correlation coefficient (R) of 0.136 and weighted average of 12.5%. Similarly, the statistical analysis conducted on geographies consisting of 326,070,583 people shows a significant positive correlation between the proportion of Central American Indians and percentage of population with a disability between the ages 34 and 64 in the United States with a correlation coefficient (R) of 0.662 and weighted average of 13.0%, a difference of 3.9%.
Disability Age 35 to 64 Correlation Summary
| Measurement | Marshallese | Central American Indian |
| Minimum | 5.1% | 5.5% |
| Maximum | 18.1% | 41.0% |
| Range | 13.0% | 35.5% |
| Mean | 12.7% | 17.2% |
| Median | 12.3% | 14.6% |
| Interquartile 25% (IQ1) | 11.5% | 12.1% |
| Interquartile 75% (IQ3) | 15.7% | 21.8% |
| Interquartile Range (IQR) | 4.3% | 9.7% |
| Standard Deviation (Sample) | 3.6% | 7.3% |
| Standard Deviation (Population) | 3.5% | 7.2% |
Demographics Similar to Marshallese and Central American Indians by Disability Age 35 to 64
In terms of disability age 35 to 64, the demographic groups most similar to Marshallese are Immigrants from Portugal (12.5%, a difference of 0.11%), White/Caucasian (12.6%, a difference of 0.71%), Subsaharan African (12.6%, a difference of 0.86%), Immigrants from Dominica (12.7%, a difference of 1.1%), and Spanish (12.7%, a difference of 1.1%). Similarly, the demographic groups most similar to Central American Indians are Nonimmigrants (13.0%, a difference of 0.14%), Immigrants from Laos (13.0%, a difference of 0.39%), Scotch-Irish (13.0%, a difference of 0.49%), Liberian (12.9%, a difference of 0.68%), and Immigrants from Micronesia (12.9%, a difference of 0.85%).
| Demographics | Rating | Rank | Disability Age 35 to 64 |
| Immigrants | Portugal | 0.4 /100 | #264 | Tragic 12.5% |
| Marshallese | 0.4 /100 | #265 | Tragic 12.5% |
| Whites/Caucasians | 0.3 /100 | #266 | Tragic 12.6% |
| Sub-Saharan Africans | 0.2 /100 | #267 | Tragic 12.6% |
| Immigrants | Dominica | 0.2 /100 | #268 | Tragic 12.7% |
| Spanish | 0.2 /100 | #269 | Tragic 12.7% |
| French | 0.2 /100 | #270 | Tragic 12.7% |
| Nepalese | 0.1 /100 | #271 | Tragic 12.8% |
| U.S. Virgin Islanders | 0.1 /100 | #272 | Tragic 12.8% |
| Pennsylvania Germans | 0.1 /100 | #273 | Tragic 12.8% |
| Celtics | 0.1 /100 | #274 | Tragic 12.9% |
| Dominicans | 0.1 /100 | #275 | Tragic 12.9% |
| Somalis | 0.1 /100 | #276 | Tragic 12.9% |
| Immigrants | Dominican Republic | 0.1 /100 | #277 | Tragic 12.9% |
| French Canadians | 0.1 /100 | #278 | Tragic 12.9% |
| Immigrants | Micronesia | 0.1 /100 | #279 | Tragic 12.9% |
| Liberians | 0.1 /100 | #280 | Tragic 12.9% |
| Scotch-Irish | 0.1 /100 | #281 | Tragic 13.0% |
| Immigrants | Laos | 0.1 /100 | #282 | Tragic 13.0% |
| Central American Indians | 0.0 /100 | #283 | Tragic 13.0% |
| Immigrants | Nonimmigrants | 0.0 /100 | #284 | Tragic 13.0% |