Macedonian vs Pima Cognitive Disability
COMPARE
Macedonian
Pima
Cognitive Disability
Cognitive Disability Comparison
Macedonians
Pima
16.5%
COGNITIVE DISABILITY
99.8/ 100
METRIC RATING
44th/ 347
METRIC RANK
18.8%
COGNITIVE DISABILITY
0.0/ 100
METRIC RATING
331st/ 347
METRIC RANK
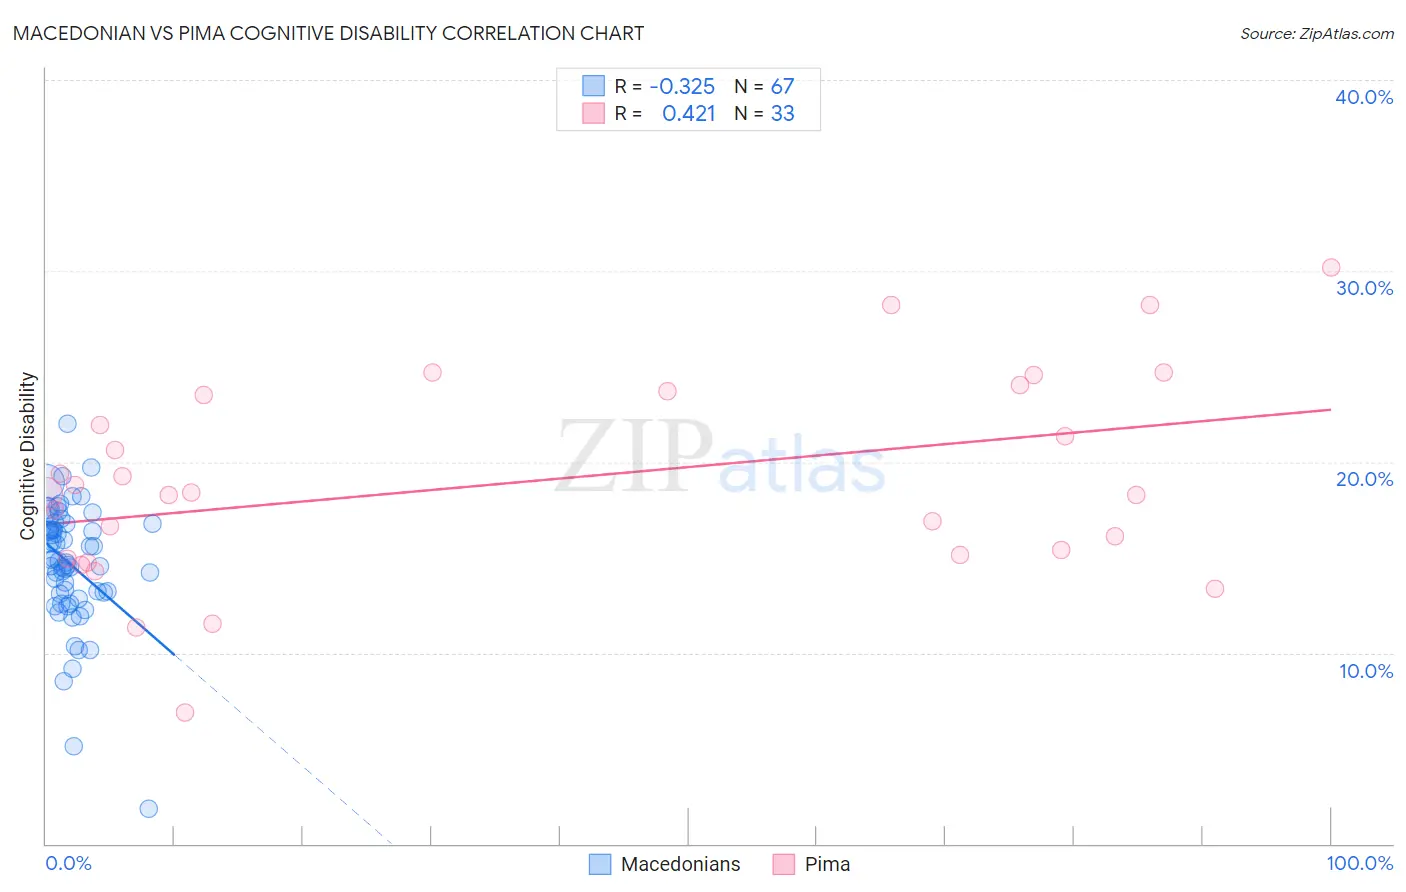
Macedonian vs Pima Cognitive Disability Correlation Chart
The statistical analysis conducted on geographies consisting of 132,658,895 people shows a mild negative correlation between the proportion of Macedonians and percentage of population with cognitive disability in the United States with a correlation coefficient (R) of -0.325 and weighted average of 16.5%. Similarly, the statistical analysis conducted on geographies consisting of 61,542,171 people shows a moderate positive correlation between the proportion of Pima and percentage of population with cognitive disability in the United States with a correlation coefficient (R) of 0.421 and weighted average of 18.8%, a difference of 14.0%.
Cognitive Disability Correlation Summary
| Measurement | Macedonian | Pima |
| Minimum | 1.8% | 6.9% |
| Maximum | 22.0% | 30.2% |
| Range | 20.2% | 23.3% |
| Mean | 14.6% | 19.0% |
| Median | 14.8% | 18.4% |
| Interquartile 25% (IQ1) | 13.1% | 15.0% |
| Interquartile 75% (IQ3) | 16.8% | 23.6% |
| Interquartile Range (IQR) | 3.7% | 8.6% |
| Standard Deviation (Sample) | 3.2% | 5.3% |
| Standard Deviation (Population) | 3.2% | 5.2% |
Similar Demographics by Cognitive Disability
Demographics Similar to Macedonians by Cognitive Disability
In terms of cognitive disability, the demographic groups most similar to Macedonians are Immigrants from Europe (16.5%, a difference of 0.010%), Immigrants from Colombia (16.5%, a difference of 0.020%), Immigrants from Canada (16.5%, a difference of 0.030%), Immigrants from Italy (16.5%, a difference of 0.050%), and Immigrants from North America (16.5%, a difference of 0.050%).
| Demographics | Rating | Rank | Cognitive Disability |
| Slovenes | 99.9 /100 | #37 | Exceptional 16.5% |
| Immigrants | Eastern Europe | 99.9 /100 | #38 | Exceptional 16.5% |
| Bolivians | 99.9 /100 | #39 | Exceptional 16.5% |
| Immigrants | Belarus | 99.9 /100 | #40 | Exceptional 16.5% |
| Cubans | 99.9 /100 | #41 | Exceptional 16.5% |
| Hungarians | 99.9 /100 | #42 | Exceptional 16.5% |
| Immigrants | Canada | 99.8 /100 | #43 | Exceptional 16.5% |
| Macedonians | 99.8 /100 | #44 | Exceptional 16.5% |
| Immigrants | Europe | 99.8 /100 | #45 | Exceptional 16.5% |
| Immigrants | Colombia | 99.8 /100 | #46 | Exceptional 16.5% |
| Immigrants | Italy | 99.8 /100 | #47 | Exceptional 16.5% |
| Immigrants | North America | 99.8 /100 | #48 | Exceptional 16.5% |
| Iranians | 99.8 /100 | #49 | Exceptional 16.5% |
| Norwegians | 99.8 /100 | #50 | Exceptional 16.5% |
| Immigrants | Korea | 99.8 /100 | #51 | Exceptional 16.5% |
Demographics Similar to Pima by Cognitive Disability
In terms of cognitive disability, the demographic groups most similar to Pima are Immigrants from Sudan (18.8%, a difference of 0.020%), Immigrants from Dominican Republic (18.8%, a difference of 0.070%), Immigrants from Yemen (18.8%, a difference of 0.070%), Navajo (18.8%, a difference of 0.16%), and Kiowa (18.7%, a difference of 0.39%).
| Demographics | Rating | Rank | Cognitive Disability |
| Dominicans | 0.0 /100 | #324 | Tragic 18.7% |
| Indonesians | 0.0 /100 | #325 | Tragic 18.7% |
| Immigrants | Senegal | 0.0 /100 | #326 | Tragic 18.7% |
| U.S. Virgin Islanders | 0.0 /100 | #327 | Tragic 18.7% |
| Kiowa | 0.0 /100 | #328 | Tragic 18.7% |
| Navajo | 0.0 /100 | #329 | Tragic 18.8% |
| Immigrants | Dominican Republic | 0.0 /100 | #330 | Tragic 18.8% |
| Pima | 0.0 /100 | #331 | Tragic 18.8% |
| Immigrants | Sudan | 0.0 /100 | #332 | Tragic 18.8% |
| Immigrants | Yemen | 0.0 /100 | #333 | Tragic 18.8% |
| Sudanese | 0.0 /100 | #334 | Tragic 18.9% |
| Senegalese | 0.0 /100 | #335 | Tragic 19.0% |
| Blacks/African Americans | 0.0 /100 | #336 | Tragic 19.0% |
| Immigrants | Saudi Arabia | 0.0 /100 | #337 | Tragic 19.1% |
| Lumbee | 0.0 /100 | #338 | Tragic 19.1% |