Macedonian vs Immigrants from Asia Cognitive Disability
COMPARE
Macedonian
Immigrants from Asia
Cognitive Disability
Cognitive Disability Comparison
Macedonians
Immigrants from Asia
16.5%
COGNITIVE DISABILITY
99.8/ 100
METRIC RATING
44th/ 347
METRIC RANK
16.8%
COGNITIVE DISABILITY
98.1/ 100
METRIC RATING
101st/ 347
METRIC RANK
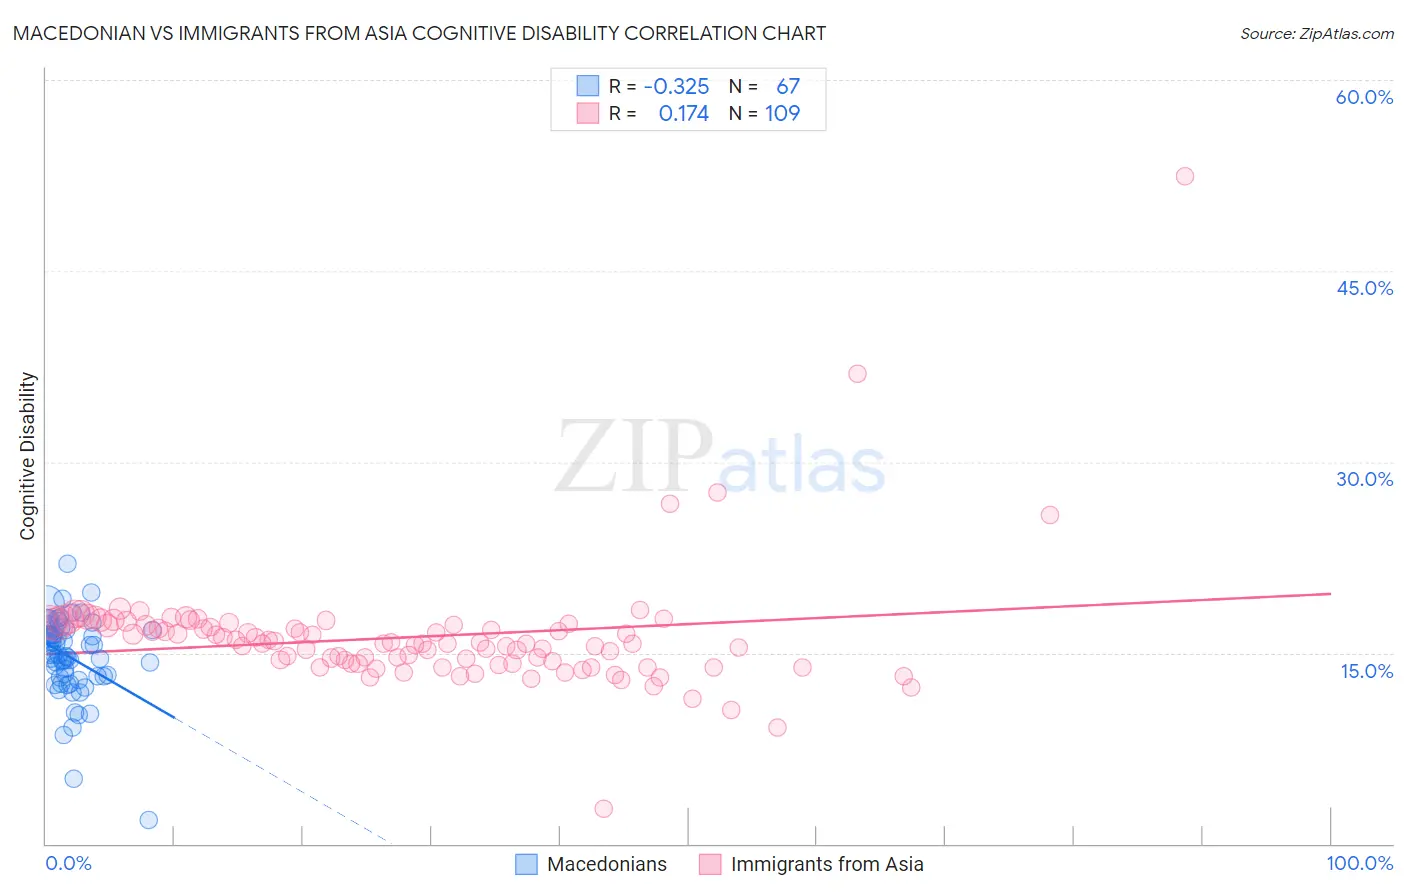
Macedonian vs Immigrants from Asia Cognitive Disability Correlation Chart
The statistical analysis conducted on geographies consisting of 132,658,895 people shows a mild negative correlation between the proportion of Macedonians and percentage of population with cognitive disability in the United States with a correlation coefficient (R) of -0.325 and weighted average of 16.5%. Similarly, the statistical analysis conducted on geographies consisting of 549,051,974 people shows a poor positive correlation between the proportion of Immigrants from Asia and percentage of population with cognitive disability in the United States with a correlation coefficient (R) of 0.174 and weighted average of 16.8%, a difference of 1.8%.
Cognitive Disability Correlation Summary
| Measurement | Macedonian | Immigrants from Asia |
| Minimum | 1.8% | 2.7% |
| Maximum | 22.0% | 52.5% |
| Range | 20.2% | 49.8% |
| Mean | 14.6% | 16.2% |
| Median | 14.8% | 15.7% |
| Interquartile 25% (IQ1) | 13.1% | 14.1% |
| Interquartile 75% (IQ3) | 16.8% | 17.2% |
| Interquartile Range (IQR) | 3.7% | 3.1% |
| Standard Deviation (Sample) | 3.2% | 5.0% |
| Standard Deviation (Population) | 3.2% | 4.9% |
Similar Demographics by Cognitive Disability
Demographics Similar to Macedonians by Cognitive Disability
In terms of cognitive disability, the demographic groups most similar to Macedonians are Immigrants from Europe (16.5%, a difference of 0.010%), Immigrants from Colombia (16.5%, a difference of 0.020%), Immigrants from Canada (16.5%, a difference of 0.030%), Immigrants from Italy (16.5%, a difference of 0.050%), and Immigrants from North America (16.5%, a difference of 0.050%).
| Demographics | Rating | Rank | Cognitive Disability |
| Slovenes | 99.9 /100 | #37 | Exceptional 16.5% |
| Immigrants | Eastern Europe | 99.9 /100 | #38 | Exceptional 16.5% |
| Bolivians | 99.9 /100 | #39 | Exceptional 16.5% |
| Immigrants | Belarus | 99.9 /100 | #40 | Exceptional 16.5% |
| Cubans | 99.9 /100 | #41 | Exceptional 16.5% |
| Hungarians | 99.9 /100 | #42 | Exceptional 16.5% |
| Immigrants | Canada | 99.8 /100 | #43 | Exceptional 16.5% |
| Macedonians | 99.8 /100 | #44 | Exceptional 16.5% |
| Immigrants | Europe | 99.8 /100 | #45 | Exceptional 16.5% |
| Immigrants | Colombia | 99.8 /100 | #46 | Exceptional 16.5% |
| Immigrants | Italy | 99.8 /100 | #47 | Exceptional 16.5% |
| Immigrants | North America | 99.8 /100 | #48 | Exceptional 16.5% |
| Iranians | 99.8 /100 | #49 | Exceptional 16.5% |
| Norwegians | 99.8 /100 | #50 | Exceptional 16.5% |
| Immigrants | Korea | 99.8 /100 | #51 | Exceptional 16.5% |
Demographics Similar to Immigrants from Asia by Cognitive Disability
In terms of cognitive disability, the demographic groups most similar to Immigrants from Asia are Immigrants from Russia (16.8%, a difference of 0.0%), Irish (16.8%, a difference of 0.030%), Jordanian (16.8%, a difference of 0.040%), Paraguayan (16.8%, a difference of 0.070%), and Palestinian (16.8%, a difference of 0.070%).
| Demographics | Rating | Rank | Cognitive Disability |
| Asians | 98.7 /100 | #94 | Exceptional 16.7% |
| English | 98.6 /100 | #95 | Exceptional 16.8% |
| Finns | 98.5 /100 | #96 | Exceptional 16.8% |
| Dutch | 98.5 /100 | #97 | Exceptional 16.8% |
| Immigrants | Lebanon | 98.4 /100 | #98 | Exceptional 16.8% |
| Jordanians | 98.2 /100 | #99 | Exceptional 16.8% |
| Immigrants | Russia | 98.2 /100 | #100 | Exceptional 16.8% |
| Immigrants | Asia | 98.1 /100 | #101 | Exceptional 16.8% |
| Irish | 98.1 /100 | #102 | Exceptional 16.8% |
| Paraguayans | 98.0 /100 | #103 | Exceptional 16.8% |
| Palestinians | 98.0 /100 | #104 | Exceptional 16.8% |
| Immigrants | Eastern Asia | 97.9 /100 | #105 | Exceptional 16.8% |
| Northern Europeans | 97.8 /100 | #106 | Exceptional 16.8% |
| Immigrants | Nicaragua | 97.8 /100 | #107 | Exceptional 16.8% |
| Canadians | 97.5 /100 | #108 | Exceptional 16.8% |