Salvadoran vs Immigrants from Asia Cognitive Disability
COMPARE
Salvadoran
Immigrants from Asia
Cognitive Disability
Cognitive Disability Comparison
Salvadorans
Immigrants from Asia
17.6%
COGNITIVE DISABILITY
6.7/ 100
METRIC RATING
217th/ 347
METRIC RANK
16.8%
COGNITIVE DISABILITY
98.1/ 100
METRIC RATING
101st/ 347
METRIC RANK
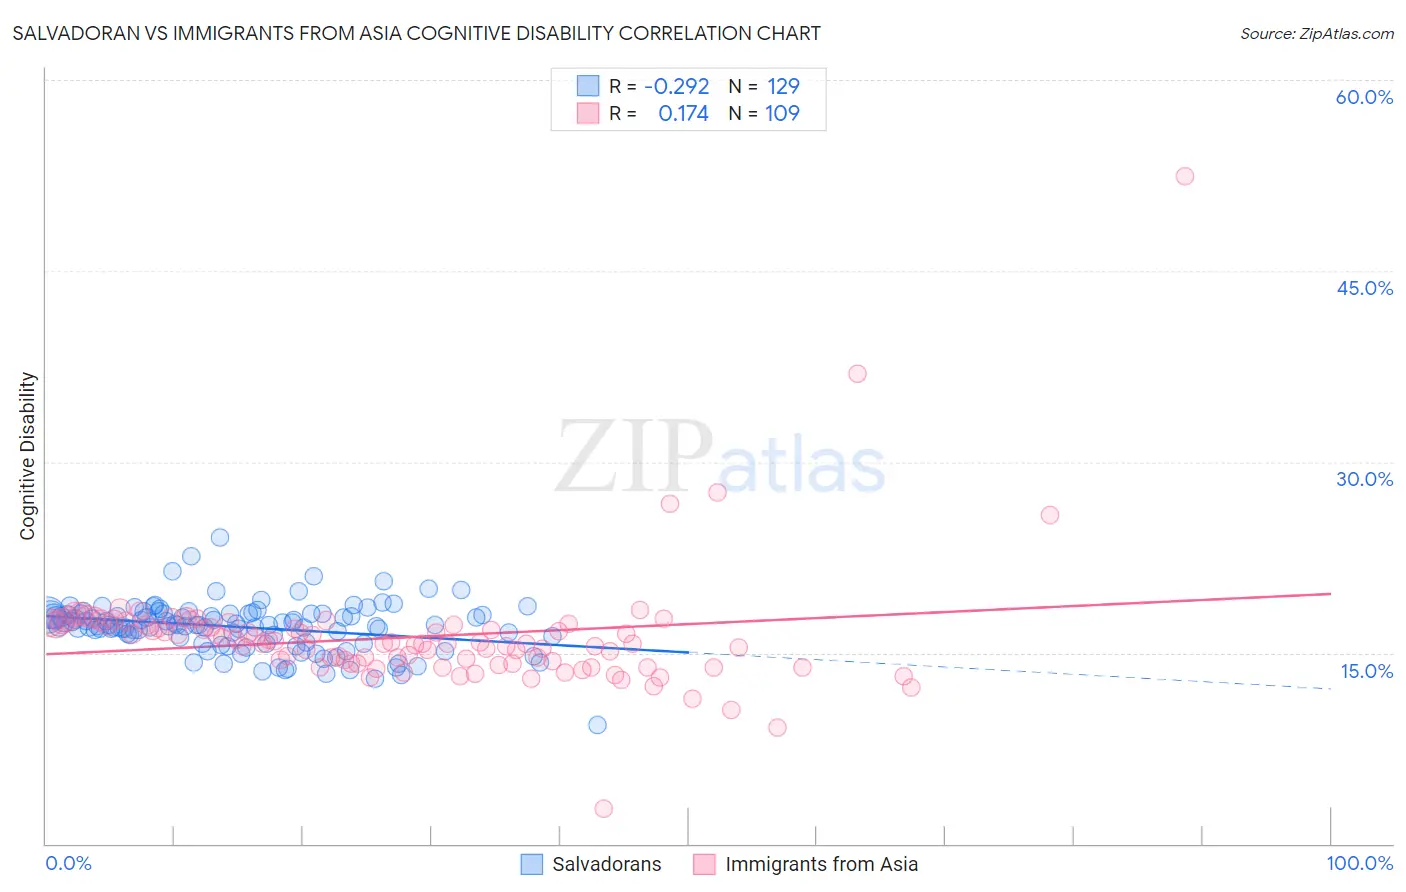
Salvadoran vs Immigrants from Asia Cognitive Disability Correlation Chart
The statistical analysis conducted on geographies consisting of 398,952,602 people shows a weak negative correlation between the proportion of Salvadorans and percentage of population with cognitive disability in the United States with a correlation coefficient (R) of -0.292 and weighted average of 17.6%. Similarly, the statistical analysis conducted on geographies consisting of 549,051,974 people shows a poor positive correlation between the proportion of Immigrants from Asia and percentage of population with cognitive disability in the United States with a correlation coefficient (R) of 0.174 and weighted average of 16.8%, a difference of 4.8%.
Cognitive Disability Correlation Summary
| Measurement | Salvadoran | Immigrants from Asia |
| Minimum | 9.3% | 2.7% |
| Maximum | 24.1% | 52.5% |
| Range | 14.8% | 49.8% |
| Mean | 17.0% | 16.2% |
| Median | 17.2% | 15.7% |
| Interquartile 25% (IQ1) | 16.0% | 14.1% |
| Interquartile 75% (IQ3) | 18.0% | 17.2% |
| Interquartile Range (IQR) | 2.0% | 3.1% |
| Standard Deviation (Sample) | 2.0% | 5.0% |
| Standard Deviation (Population) | 2.0% | 4.9% |
Similar Demographics by Cognitive Disability
Demographics Similar to Salvadorans by Cognitive Disability
In terms of cognitive disability, the demographic groups most similar to Salvadorans are Alaskan Athabascan (17.6%, a difference of 0.020%), Okinawan (17.6%, a difference of 0.020%), Immigrants from El Salvador (17.6%, a difference of 0.030%), Icelander (17.6%, a difference of 0.030%), and Immigrants from Sierra Leone (17.6%, a difference of 0.040%).
| Demographics | Rating | Rank | Cognitive Disability |
| Immigrants | Jamaica | 8.5 /100 | #210 | Tragic 17.6% |
| Taiwanese | 7.7 /100 | #211 | Tragic 17.6% |
| Immigrants | Oceania | 7.3 /100 | #212 | Tragic 17.6% |
| Hawaiians | 7.2 /100 | #213 | Tragic 17.6% |
| Immigrants | El Salvador | 7.0 /100 | #214 | Tragic 17.6% |
| Alaskan Athabascans | 6.9 /100 | #215 | Tragic 17.6% |
| Okinawans | 6.8 /100 | #216 | Tragic 17.6% |
| Salvadorans | 6.7 /100 | #217 | Tragic 17.6% |
| Icelanders | 6.4 /100 | #218 | Tragic 17.6% |
| Immigrants | Sierra Leone | 6.3 /100 | #219 | Tragic 17.6% |
| Zimbabweans | 6.1 /100 | #220 | Tragic 17.6% |
| Moroccans | 5.9 /100 | #221 | Tragic 17.6% |
| Central Americans | 4.5 /100 | #222 | Tragic 17.7% |
| Alsatians | 4.5 /100 | #223 | Tragic 17.7% |
| Fijians | 3.4 /100 | #224 | Tragic 17.7% |
Demographics Similar to Immigrants from Asia by Cognitive Disability
In terms of cognitive disability, the demographic groups most similar to Immigrants from Asia are Immigrants from Russia (16.8%, a difference of 0.0%), Irish (16.8%, a difference of 0.030%), Jordanian (16.8%, a difference of 0.040%), Paraguayan (16.8%, a difference of 0.070%), and Palestinian (16.8%, a difference of 0.070%).
| Demographics | Rating | Rank | Cognitive Disability |
| Asians | 98.7 /100 | #94 | Exceptional 16.7% |
| English | 98.6 /100 | #95 | Exceptional 16.8% |
| Finns | 98.5 /100 | #96 | Exceptional 16.8% |
| Dutch | 98.5 /100 | #97 | Exceptional 16.8% |
| Immigrants | Lebanon | 98.4 /100 | #98 | Exceptional 16.8% |
| Jordanians | 98.2 /100 | #99 | Exceptional 16.8% |
| Immigrants | Russia | 98.2 /100 | #100 | Exceptional 16.8% |
| Immigrants | Asia | 98.1 /100 | #101 | Exceptional 16.8% |
| Irish | 98.1 /100 | #102 | Exceptional 16.8% |
| Paraguayans | 98.0 /100 | #103 | Exceptional 16.8% |
| Palestinians | 98.0 /100 | #104 | Exceptional 16.8% |
| Immigrants | Eastern Asia | 97.9 /100 | #105 | Exceptional 16.8% |
| Northern Europeans | 97.8 /100 | #106 | Exceptional 16.8% |
| Immigrants | Nicaragua | 97.8 /100 | #107 | Exceptional 16.8% |
| Canadians | 97.5 /100 | #108 | Exceptional 16.8% |