Luxembourger vs Immigrants from St. Vincent and the Grenadines Self-Care Disability
COMPARE
Luxembourger
Immigrants from St. Vincent and the Grenadines
Self-Care Disability
Self-Care Disability Comparison
Luxembourgers
Immigrants from St. Vincent and the Grenadines
2.2%
SELF-CARE DISABILITY
100.0/ 100
METRIC RATING
14th/ 347
METRIC RANK
2.8%
SELF-CARE DISABILITY
0.0/ 100
METRIC RATING
302nd/ 347
METRIC RANK
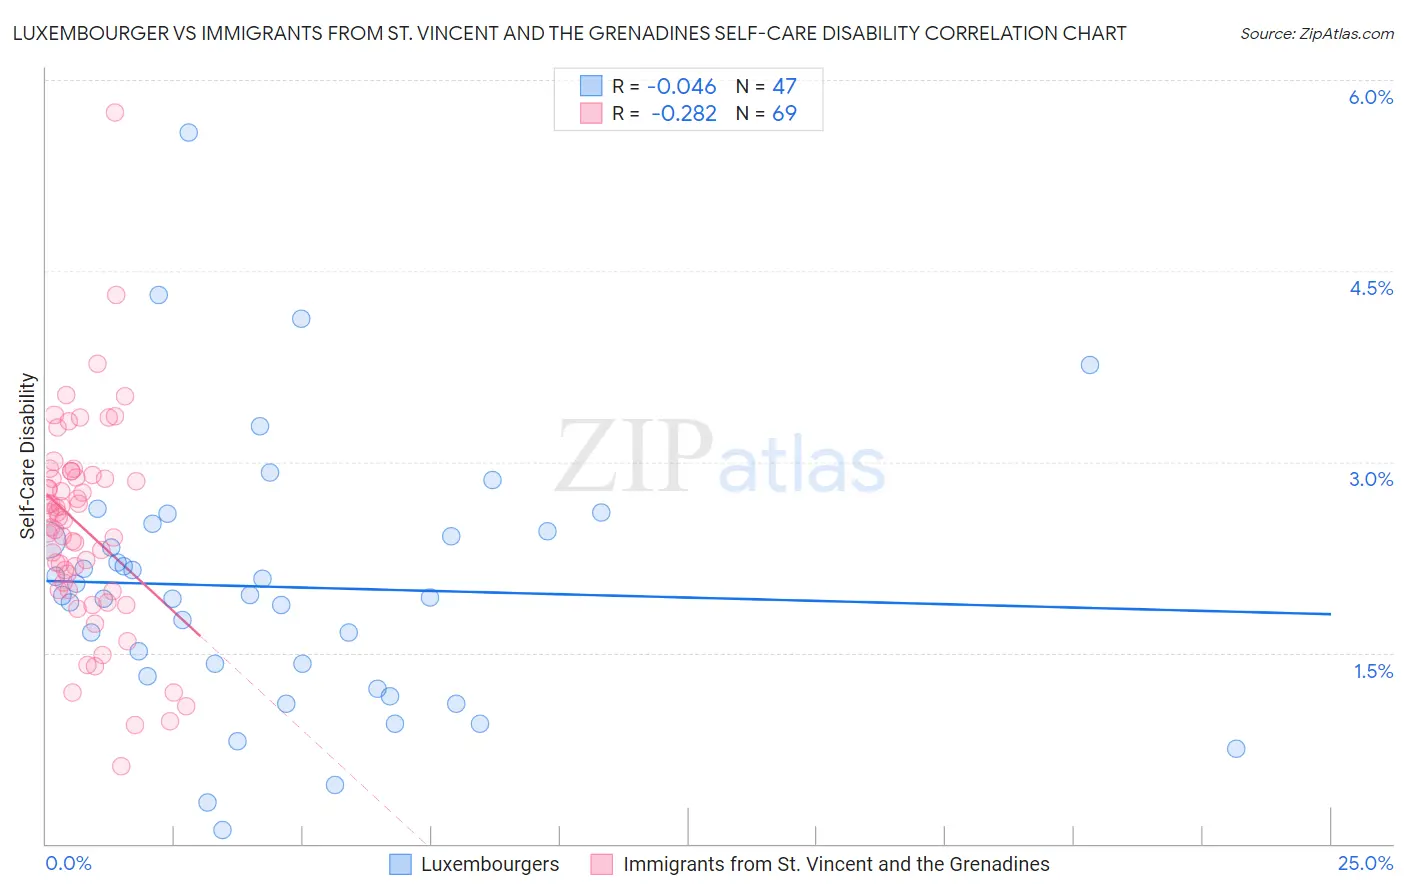
Luxembourger vs Immigrants from St. Vincent and the Grenadines Self-Care Disability Correlation Chart
The statistical analysis conducted on geographies consisting of 144,609,683 people shows no correlation between the proportion of Luxembourgers and percentage of population with self-care disability in the United States with a correlation coefficient (R) of -0.046 and weighted average of 2.2%. Similarly, the statistical analysis conducted on geographies consisting of 56,160,943 people shows a weak negative correlation between the proportion of Immigrants from St. Vincent and the Grenadines and percentage of population with self-care disability in the United States with a correlation coefficient (R) of -0.282 and weighted average of 2.8%, a difference of 26.6%.
Self-Care Disability Correlation Summary
| Measurement | Luxembourger | Immigrants from St. Vincent and the Grenadines |
| Minimum | 0.11% | 0.61% |
| Maximum | 5.6% | 5.7% |
| Range | 5.5% | 5.1% |
| Mean | 2.0% | 2.5% |
| Median | 1.9% | 2.5% |
| Interquartile 25% (IQ1) | 1.3% | 2.0% |
| Interquartile 75% (IQ3) | 2.5% | 2.9% |
| Interquartile Range (IQR) | 1.1% | 0.89% |
| Standard Deviation (Sample) | 1.0% | 0.82% |
| Standard Deviation (Population) | 1.0% | 0.82% |
Similar Demographics by Self-Care Disability
Demographics Similar to Luxembourgers by Self-Care Disability
In terms of self-care disability, the demographic groups most similar to Luxembourgers are Okinawan (2.2%, a difference of 0.010%), Ethiopian (2.2%, a difference of 0.16%), Immigrants from Ethiopia (2.2%, a difference of 0.17%), Immigrants from South Central Asia (2.2%, a difference of 0.23%), and Immigrants from Kuwait (2.2%, a difference of 0.29%).
| Demographics | Rating | Rank | Self-Care Disability |
| Immigrants | Bolivia | 100.0 /100 | #7 | Exceptional 2.2% |
| Bolivians | 100.0 /100 | #8 | Exceptional 2.2% |
| Immigrants | Nepal | 100.0 /100 | #9 | Exceptional 2.2% |
| Sudanese | 100.0 /100 | #10 | Exceptional 2.2% |
| Immigrants | South Central Asia | 100.0 /100 | #11 | Exceptional 2.2% |
| Immigrants | Ethiopia | 100.0 /100 | #12 | Exceptional 2.2% |
| Ethiopians | 100.0 /100 | #13 | Exceptional 2.2% |
| Luxembourgers | 100.0 /100 | #14 | Exceptional 2.2% |
| Okinawans | 100.0 /100 | #15 | Exceptional 2.2% |
| Immigrants | Kuwait | 100.0 /100 | #16 | Exceptional 2.2% |
| Immigrants | Saudi Arabia | 100.0 /100 | #17 | Exceptional 2.2% |
| Immigrants | Taiwan | 100.0 /100 | #18 | Exceptional 2.2% |
| Immigrants | Eritrea | 100.0 /100 | #19 | Exceptional 2.2% |
| Tongans | 100.0 /100 | #20 | Exceptional 2.2% |
| Bulgarians | 100.0 /100 | #21 | Exceptional 2.2% |
Demographics Similar to Immigrants from St. Vincent and the Grenadines by Self-Care Disability
In terms of self-care disability, the demographic groups most similar to Immigrants from St. Vincent and the Grenadines are Pima (2.8%, a difference of 0.040%), Immigrants from Fiji (2.8%, a difference of 0.13%), Immigrants from Belize (2.8%, a difference of 0.15%), Cree (2.8%, a difference of 0.30%), and Immigrants from West Indies (2.8%, a difference of 0.35%).
| Demographics | Rating | Rank | Self-Care Disability |
| Barbadians | 0.0 /100 | #295 | Tragic 2.7% |
| Immigrants | Portugal | 0.0 /100 | #296 | Tragic 2.8% |
| West Indians | 0.0 /100 | #297 | Tragic 2.8% |
| Americans | 0.0 /100 | #298 | Tragic 2.8% |
| Immigrants | Guyana | 0.0 /100 | #299 | Tragic 2.8% |
| Immigrants | Fiji | 0.0 /100 | #300 | Tragic 2.8% |
| Pima | 0.0 /100 | #301 | Tragic 2.8% |
| Immigrants | St. Vincent and the Grenadines | 0.0 /100 | #302 | Tragic 2.8% |
| Immigrants | Belize | 0.0 /100 | #303 | Tragic 2.8% |
| Cree | 0.0 /100 | #304 | Tragic 2.8% |
| Immigrants | West Indies | 0.0 /100 | #305 | Tragic 2.8% |
| Aleuts | 0.0 /100 | #306 | Tragic 2.8% |
| Natives/Alaskans | 0.0 /100 | #307 | Tragic 2.8% |
| Immigrants | Grenada | 0.0 /100 | #308 | Tragic 2.8% |
| Bangladeshis | 0.0 /100 | #309 | Tragic 2.8% |