Lithuanian vs Israeli Disability Age 65 to 74
COMPARE
Lithuanian
Israeli
Disability Age 65 to 74
Disability Age 65 to 74 Comparison
Lithuanians
Israelis
21.4%
DISABILITY AGE 65 TO 74
99.7/ 100
METRIC RATING
48th/ 347
METRIC RANK
21.2%
DISABILITY AGE 65 TO 74
99.8/ 100
METRIC RATING
37th/ 347
METRIC RANK
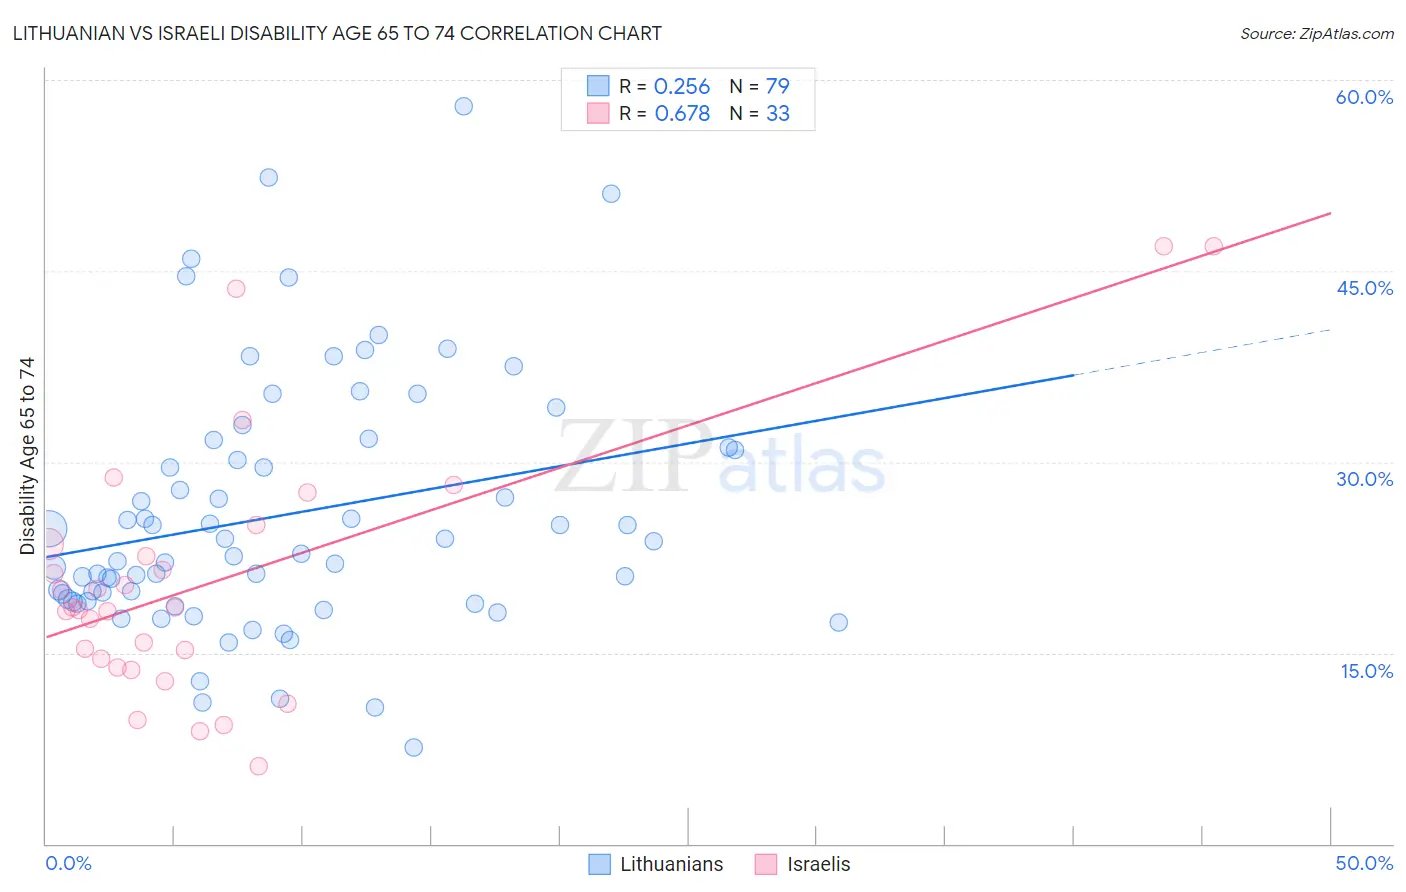
Lithuanian vs Israeli Disability Age 65 to 74 Correlation Chart
The statistical analysis conducted on geographies consisting of 421,207,937 people shows a weak positive correlation between the proportion of Lithuanians and percentage of population with a disability between the ages 65 and 75 in the United States with a correlation coefficient (R) of 0.256 and weighted average of 21.4%. Similarly, the statistical analysis conducted on geographies consisting of 210,778,329 people shows a significant positive correlation between the proportion of Israelis and percentage of population with a disability between the ages 65 and 75 in the United States with a correlation coefficient (R) of 0.678 and weighted average of 21.2%, a difference of 1.1%.
Disability Age 65 to 74 Correlation Summary
| Measurement | Lithuanian | Israeli |
| Minimum | 7.6% | 6.1% |
| Maximum | 57.9% | 46.9% |
| Range | 50.3% | 40.8% |
| Mean | 25.8% | 20.8% |
| Median | 22.8% | 18.5% |
| Interquartile 25% (IQ1) | 19.1% | 14.2% |
| Interquartile 75% (IQ3) | 31.1% | 24.3% |
| Interquartile Range (IQR) | 12.0% | 10.1% |
| Standard Deviation (Sample) | 9.9% | 10.1% |
| Standard Deviation (Population) | 9.9% | 10.0% |
Demographics Similar to Lithuanians and Israelis by Disability Age 65 to 74
In terms of disability age 65 to 74, the demographic groups most similar to Lithuanians are Luxembourger (21.4%, a difference of 0.010%), Immigrants from Malaysia (21.4%, a difference of 0.030%), Immigrants from Turkey (21.4%, a difference of 0.050%), Immigrants from Bulgaria (21.4%, a difference of 0.050%), and Asian (21.4%, a difference of 0.080%). Similarly, the demographic groups most similar to Israelis are Russian (21.2%, a difference of 0.0%), Immigrants from Switzerland (21.1%, a difference of 0.11%), Argentinean (21.2%, a difference of 0.19%), Bulgarian (21.1%, a difference of 0.30%), and Latvian (21.2%, a difference of 0.35%).
| Demographics | Rating | Rank | Disability Age 65 to 74 |
| Turks | 99.9 /100 | #32 | Exceptional 21.0% |
| Immigrants | Argentina | 99.9 /100 | #33 | Exceptional 21.1% |
| Immigrants | Sri Lanka | 99.9 /100 | #34 | Exceptional 21.1% |
| Bulgarians | 99.9 /100 | #35 | Exceptional 21.1% |
| Immigrants | Switzerland | 99.8 /100 | #36 | Exceptional 21.1% |
| Israelis | 99.8 /100 | #37 | Exceptional 21.2% |
| Russians | 99.8 /100 | #38 | Exceptional 21.2% |
| Argentineans | 99.8 /100 | #39 | Exceptional 21.2% |
| Latvians | 99.8 /100 | #40 | Exceptional 21.2% |
| Immigrants | Austria | 99.8 /100 | #41 | Exceptional 21.2% |
| Macedonians | 99.7 /100 | #42 | Exceptional 21.3% |
| Immigrants | Croatia | 99.7 /100 | #43 | Exceptional 21.3% |
| Estonians | 99.7 /100 | #44 | Exceptional 21.4% |
| Asians | 99.7 /100 | #45 | Exceptional 21.4% |
| Immigrants | Turkey | 99.7 /100 | #46 | Exceptional 21.4% |
| Immigrants | Bulgaria | 99.7 /100 | #47 | Exceptional 21.4% |
| Lithuanians | 99.7 /100 | #48 | Exceptional 21.4% |
| Luxembourgers | 99.7 /100 | #49 | Exceptional 21.4% |
| Immigrants | Malaysia | 99.7 /100 | #50 | Exceptional 21.4% |
| Immigrants | Serbia | 99.6 /100 | #51 | Exceptional 21.4% |
| Immigrants | France | 99.6 /100 | #52 | Exceptional 21.5% |