Immigrants from Jordan vs Dutch West Indian Disability Age 18 to 34
COMPARE
Immigrants from Jordan
Dutch West Indian
Disability Age 18 to 34
Disability Age 18 to 34 Comparison
Immigrants from Jordan
Dutch West Indians
6.3%
DISABILITY AGE 18 TO 34
94.0/ 100
METRIC RATING
117th/ 347
METRIC RANK
8.4%
DISABILITY AGE 18 TO 34
0.0/ 100
METRIC RATING
334th/ 347
METRIC RANK
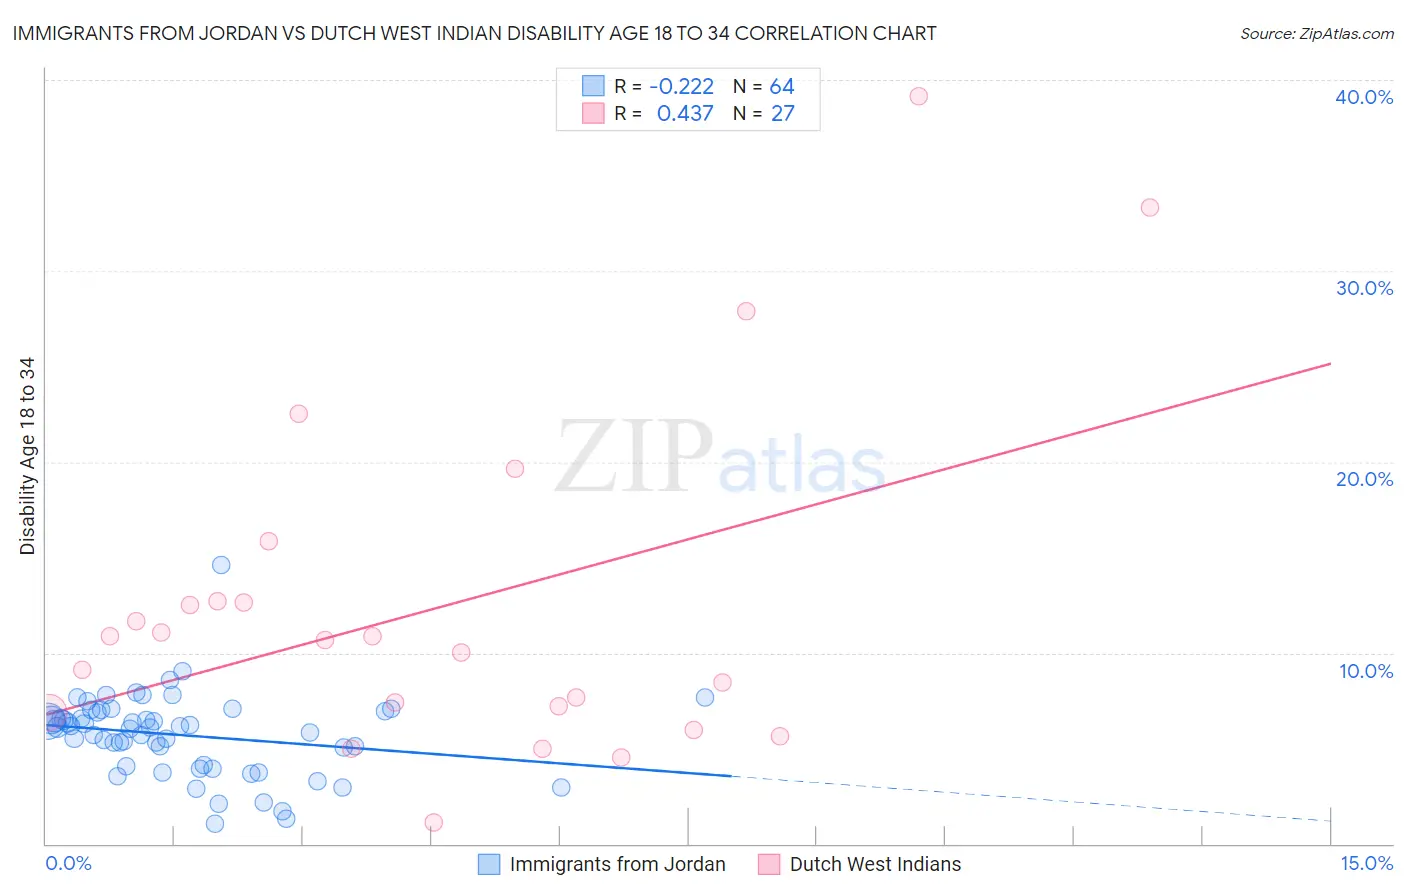
Immigrants from Jordan vs Dutch West Indian Disability Age 18 to 34 Correlation Chart
The statistical analysis conducted on geographies consisting of 181,170,732 people shows a weak negative correlation between the proportion of Immigrants from Jordan and percentage of population with a disability between the ages 18 and 35 in the United States with a correlation coefficient (R) of -0.222 and weighted average of 6.3%. Similarly, the statistical analysis conducted on geographies consisting of 85,713,308 people shows a moderate positive correlation between the proportion of Dutch West Indians and percentage of population with a disability between the ages 18 and 35 in the United States with a correlation coefficient (R) of 0.437 and weighted average of 8.4%, a difference of 34.2%.
Disability Age 18 to 34 Correlation Summary
| Measurement | Immigrants from Jordan | Dutch West Indian |
| Minimum | 1.1% | 1.1% |
| Maximum | 14.6% | 39.1% |
| Range | 13.5% | 38.0% |
| Mean | 5.7% | 12.4% |
| Median | 6.1% | 10.7% |
| Interquartile 25% (IQ1) | 4.1% | 6.9% |
| Interquartile 75% (IQ3) | 6.9% | 12.7% |
| Interquartile Range (IQR) | 2.8% | 5.8% |
| Standard Deviation (Sample) | 2.1% | 9.0% |
| Standard Deviation (Population) | 2.1% | 8.8% |
Similar Demographics by Disability Age 18 to 34
Demographics Similar to Immigrants from Jordan by Disability Age 18 to 34
In terms of disability age 18 to 34, the demographic groups most similar to Immigrants from Jordan are Immigrants from Costa Rica (6.3%, a difference of 0.0%), Korean (6.3%, a difference of 0.030%), Immigrants from Nepal (6.3%, a difference of 0.090%), Immigrants from South Eastern Asia (6.3%, a difference of 0.15%), and Chilean (6.3%, a difference of 0.15%).
| Demographics | Rating | Rank | Disability Age 18 to 34 |
| Immigrants | Brazil | 95.2 /100 | #110 | Exceptional 6.3% |
| Immigrants | France | 95.1 /100 | #111 | Exceptional 6.3% |
| Immigrants | Romania | 94.9 /100 | #112 | Exceptional 6.3% |
| Immigrants | Latin America | 94.9 /100 | #113 | Exceptional 6.3% |
| Immigrants | South Eastern Asia | 94.4 /100 | #114 | Exceptional 6.3% |
| Koreans | 94.1 /100 | #115 | Exceptional 6.3% |
| Immigrants | Costa Rica | 94.0 /100 | #116 | Exceptional 6.3% |
| Immigrants | Jordan | 94.0 /100 | #117 | Exceptional 6.3% |
| Immigrants | Nepal | 93.7 /100 | #118 | Exceptional 6.3% |
| Chileans | 93.5 /100 | #119 | Exceptional 6.3% |
| Immigrants | Ukraine | 93.4 /100 | #120 | Exceptional 6.3% |
| Immigrants | Guatemala | 93.4 /100 | #121 | Exceptional 6.3% |
| Immigrants | Czechoslovakia | 93.3 /100 | #122 | Exceptional 6.3% |
| Costa Ricans | 92.9 /100 | #123 | Exceptional 6.3% |
| Immigrants | Morocco | 92.9 /100 | #124 | Exceptional 6.3% |
Demographics Similar to Dutch West Indians by Disability Age 18 to 34
In terms of disability age 18 to 34, the demographic groups most similar to Dutch West Indians are Seminole (8.4%, a difference of 0.11%), Apache (8.4%, a difference of 0.21%), Puget Sound Salish (8.3%, a difference of 1.3%), Immigrants from the Azores (8.5%, a difference of 1.3%), and Comanche (8.3%, a difference of 1.5%).
| Demographics | Rating | Rank | Disability Age 18 to 34 |
| Sioux | 0.0 /100 | #327 | Tragic 8.2% |
| Delaware | 0.0 /100 | #328 | Tragic 8.2% |
| Crow | 0.0 /100 | #329 | Tragic 8.3% |
| Osage | 0.0 /100 | #330 | Tragic 8.3% |
| Comanche | 0.0 /100 | #331 | Tragic 8.3% |
| Puget Sound Salish | 0.0 /100 | #332 | Tragic 8.3% |
| Apache | 0.0 /100 | #333 | Tragic 8.4% |
| Dutch West Indians | 0.0 /100 | #334 | Tragic 8.4% |
| Seminole | 0.0 /100 | #335 | Tragic 8.4% |
| Immigrants | Azores | 0.0 /100 | #336 | Tragic 8.5% |
| Ottawa | 0.0 /100 | #337 | Tragic 8.6% |
| Cherokee | 0.0 /100 | #338 | Tragic 8.7% |
| Kiowa | 0.0 /100 | #339 | Tragic 8.8% |
| Choctaw | 0.0 /100 | #340 | Tragic 9.0% |
| Chickasaw | 0.0 /100 | #341 | Tragic 9.0% |