Latvian vs Immigrants from Poland Male Disability
COMPARE
Latvian
Immigrants from Poland
Male Disability
Male Disability Comparison
Latvians
Immigrants from Poland
11.1%
MALE DISABILITY
68.1/ 100
METRIC RATING
158th/ 347
METRIC RANK
10.6%
MALE DISABILITY
98.1/ 100
METRIC RATING
83rd/ 347
METRIC RANK
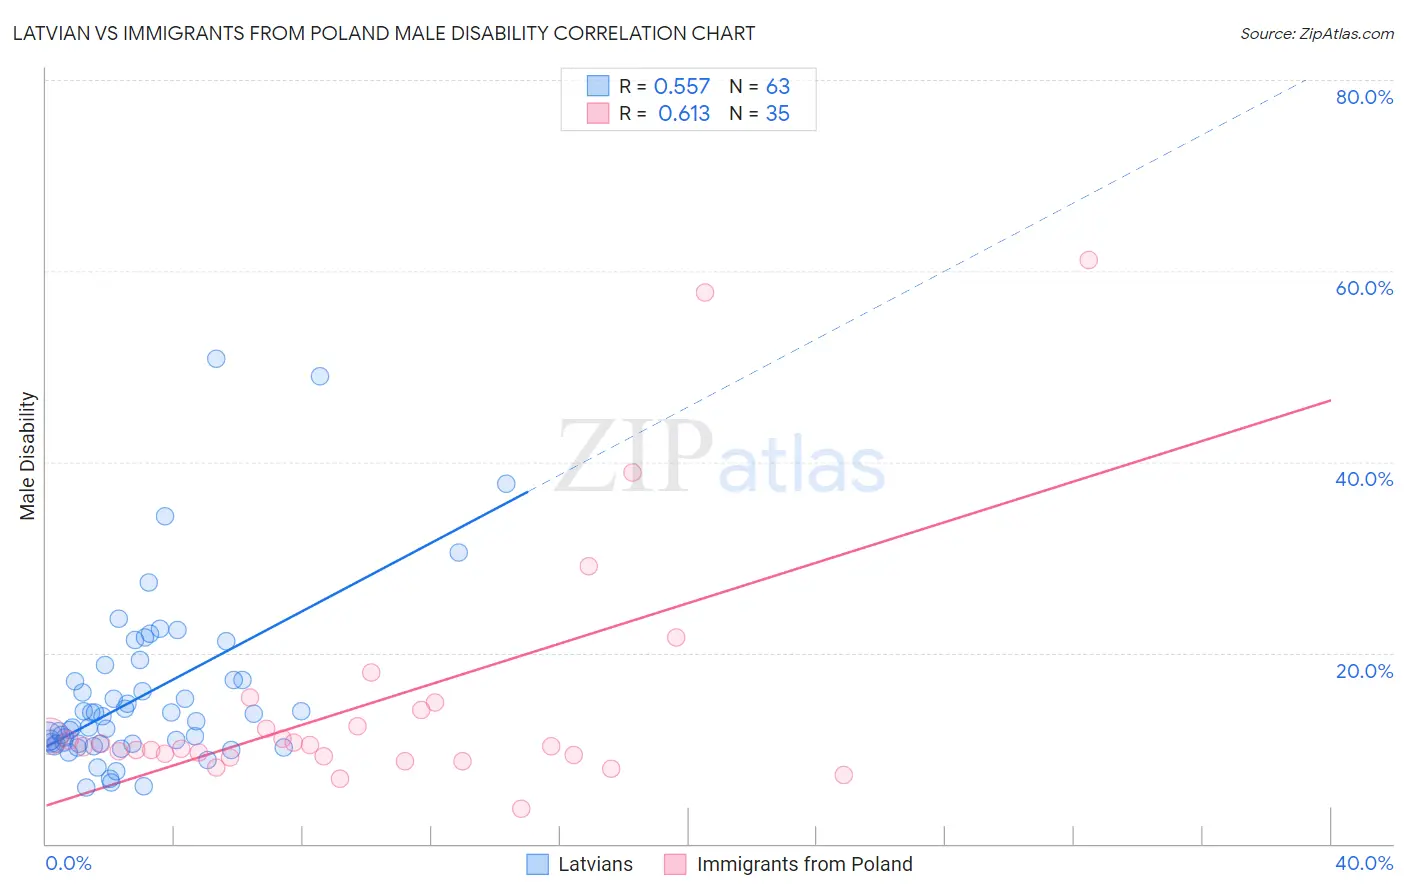
Latvian vs Immigrants from Poland Male Disability Correlation Chart
The statistical analysis conducted on geographies consisting of 220,715,476 people shows a substantial positive correlation between the proportion of Latvians and percentage of males with a disability in the United States with a correlation coefficient (R) of 0.557 and weighted average of 11.1%. Similarly, the statistical analysis conducted on geographies consisting of 304,827,487 people shows a significant positive correlation between the proportion of Immigrants from Poland and percentage of males with a disability in the United States with a correlation coefficient (R) of 0.613 and weighted average of 10.6%, a difference of 4.7%.
Male Disability Correlation Summary
| Measurement | Latvian | Immigrants from Poland |
| Minimum | 6.0% | 3.6% |
| Maximum | 50.8% | 61.1% |
| Range | 44.8% | 57.5% |
| Mean | 15.6% | 14.8% |
| Median | 12.8% | 10.2% |
| Interquartile 25% (IQ1) | 10.5% | 9.2% |
| Interquartile 75% (IQ3) | 17.2% | 14.0% |
| Interquartile Range (IQR) | 6.7% | 4.8% |
| Standard Deviation (Sample) | 9.0% | 12.9% |
| Standard Deviation (Population) | 8.9% | 12.7% |
Similar Demographics by Male Disability
Demographics Similar to Latvians by Male Disability
In terms of male disability, the demographic groups most similar to Latvians are Guatemalan (11.1%, a difference of 0.060%), Immigrants from Western Africa (11.1%, a difference of 0.070%), Russian (11.1%, a difference of 0.11%), Albanian (11.1%, a difference of 0.11%), and Immigrants from West Indies (11.1%, a difference of 0.16%).
| Demographics | Rating | Rank | Male Disability |
| Cubans | 74.9 /100 | #151 | Good 11.0% |
| Immigrants | Albania | 74.4 /100 | #152 | Good 11.0% |
| Immigrants | Northern Europe | 73.2 /100 | #153 | Good 11.1% |
| Immigrants | Moldova | 72.8 /100 | #154 | Good 11.1% |
| Immigrants | Middle Africa | 70.9 /100 | #155 | Good 11.1% |
| Russians | 69.8 /100 | #156 | Good 11.1% |
| Immigrants | Western Africa | 69.2 /100 | #157 | Good 11.1% |
| Latvians | 68.1 /100 | #158 | Good 11.1% |
| Guatemalans | 67.2 /100 | #159 | Good 11.1% |
| Albanians | 66.5 /100 | #160 | Good 11.1% |
| Immigrants | West Indies | 65.7 /100 | #161 | Good 11.1% |
| Immigrants | Haiti | 65.3 /100 | #162 | Good 11.1% |
| Immigrants | Kenya | 63.8 /100 | #163 | Good 11.1% |
| British West Indians | 62.8 /100 | #164 | Good 11.1% |
| Luxembourgers | 61.9 /100 | #165 | Good 11.1% |
Demographics Similar to Immigrants from Poland by Male Disability
In terms of male disability, the demographic groups most similar to Immigrants from Poland are Bulgarian (10.6%, a difference of 0.010%), Immigrants from Guyana (10.6%, a difference of 0.060%), Immigrants from Chile (10.6%, a difference of 0.13%), Immigrants from Jordan (10.6%, a difference of 0.19%), and Sri Lankan (10.6%, a difference of 0.19%).
| Demographics | Rating | Rank | Male Disability |
| Immigrants | Sierra Leone | 98.7 /100 | #76 | Exceptional 10.5% |
| Laotians | 98.6 /100 | #77 | Exceptional 10.6% |
| Immigrants | Russia | 98.6 /100 | #78 | Exceptional 10.6% |
| Zimbabweans | 98.4 /100 | #79 | Exceptional 10.6% |
| Immigrants | Jordan | 98.4 /100 | #80 | Exceptional 10.6% |
| Immigrants | Chile | 98.3 /100 | #81 | Exceptional 10.6% |
| Immigrants | Guyana | 98.2 /100 | #82 | Exceptional 10.6% |
| Immigrants | Poland | 98.1 /100 | #83 | Exceptional 10.6% |
| Bulgarians | 98.1 /100 | #84 | Exceptional 10.6% |
| Sri Lankans | 97.9 /100 | #85 | Exceptional 10.6% |
| Immigrants | Ireland | 97.9 /100 | #86 | Exceptional 10.6% |
| Immigrants | Vietnam | 97.9 /100 | #87 | Exceptional 10.6% |
| Immigrants | Western Asia | 97.8 /100 | #88 | Exceptional 10.6% |
| Immigrants | Nicaragua | 97.8 /100 | #89 | Exceptional 10.6% |
| Immigrants | Morocco | 97.7 /100 | #90 | Exceptional 10.6% |