Latvian vs Cambodian Disability Age Over 75
COMPARE
Latvian
Cambodian
Disability Age Over 75
Disability Age Over 75 Comparison
Latvians
Cambodians
45.1%
DISABILITY AGE OVER 75
100.0/ 100
METRIC RATING
13th/ 347
METRIC RANK
46.1%
DISABILITY AGE OVER 75
99.1/ 100
METRIC RATING
73rd/ 347
METRIC RANK
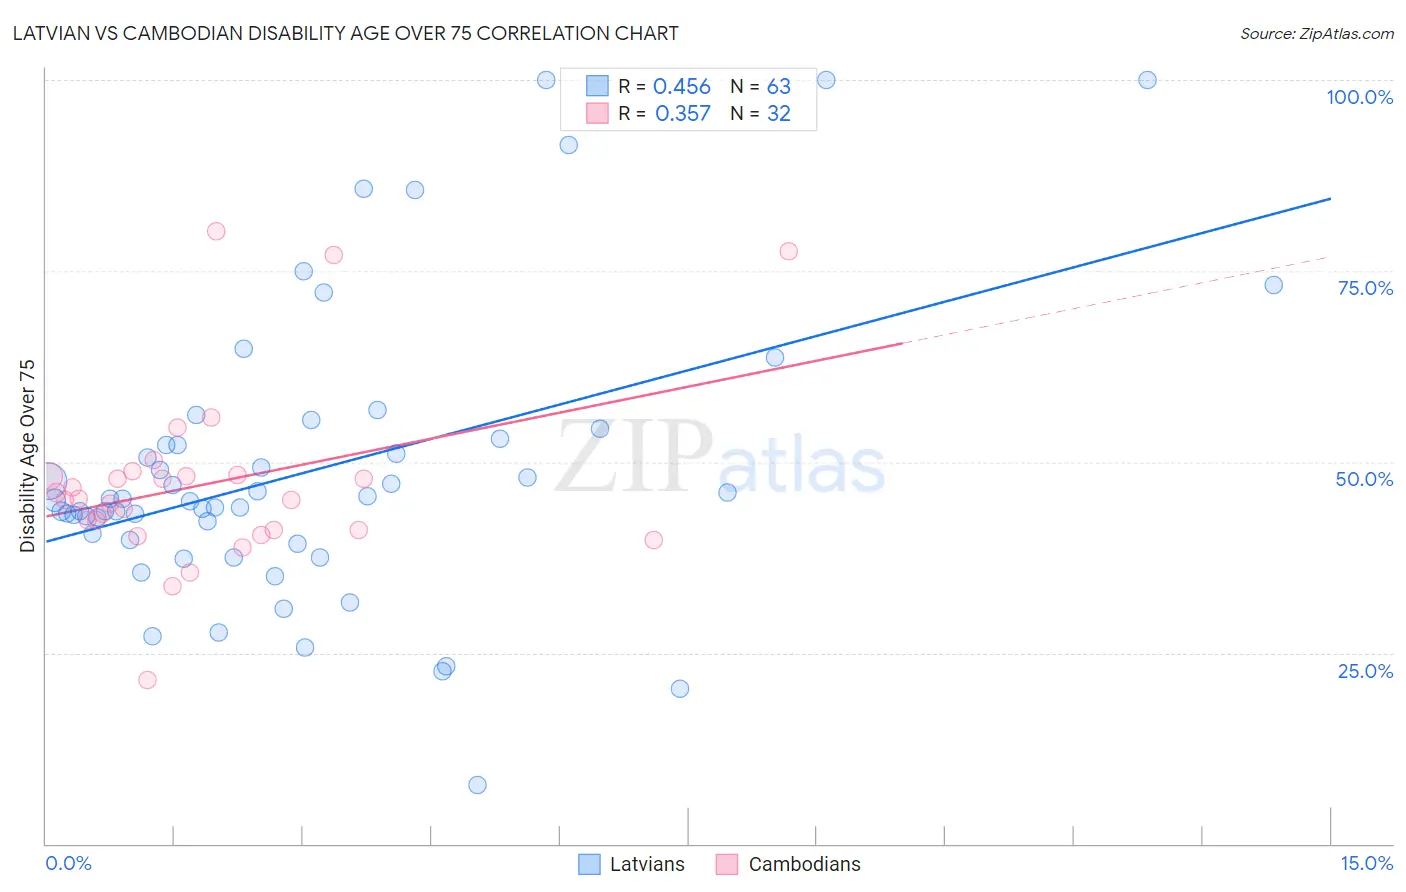
Latvian vs Cambodian Disability Age Over 75 Correlation Chart
The statistical analysis conducted on geographies consisting of 220,463,619 people shows a moderate positive correlation between the proportion of Latvians and percentage of population with a disability over the age of 75 in the United States with a correlation coefficient (R) of 0.456 and weighted average of 45.1%. Similarly, the statistical analysis conducted on geographies consisting of 102,426,643 people shows a mild positive correlation between the proportion of Cambodians and percentage of population with a disability over the age of 75 in the United States with a correlation coefficient (R) of 0.357 and weighted average of 46.1%, a difference of 2.2%.
Disability Age Over 75 Correlation Summary
| Measurement | Latvian | Cambodian |
| Minimum | 7.7% | 21.4% |
| Maximum | 100.0% | 80.2% |
| Range | 92.3% | 58.8% |
| Mean | 48.9% | 47.1% |
| Median | 44.9% | 45.1% |
| Interquartile 25% (IQ1) | 39.7% | 41.1% |
| Interquartile 75% (IQ3) | 53.1% | 48.2% |
| Interquartile Range (IQR) | 13.3% | 7.2% |
| Standard Deviation (Sample) | 19.0% | 12.0% |
| Standard Deviation (Population) | 18.8% | 11.8% |
Similar Demographics by Disability Age Over 75
Demographics Similar to Latvians by Disability Age Over 75
In terms of disability age over 75, the demographic groups most similar to Latvians are Immigrants from Czechoslovakia (45.1%, a difference of 0.010%), Immigrants from Scotland (45.1%, a difference of 0.010%), Immigrants from Sweden (45.1%, a difference of 0.050%), Lithuanian (45.1%, a difference of 0.10%), and Bulgarian (45.1%, a difference of 0.15%).
| Demographics | Rating | Rank | Disability Age Over 75 |
| Immigrants | Lithuania | 100.0 /100 | #6 | Exceptional 44.9% |
| Okinawans | 100.0 /100 | #7 | Exceptional 44.9% |
| Immigrants | Austria | 100.0 /100 | #8 | Exceptional 44.9% |
| Paraguayans | 100.0 /100 | #9 | Exceptional 45.0% |
| Bulgarians | 100.0 /100 | #10 | Exceptional 45.1% |
| Lithuanians | 100.0 /100 | #11 | Exceptional 45.1% |
| Immigrants | Czechoslovakia | 100.0 /100 | #12 | Exceptional 45.1% |
| Latvians | 100.0 /100 | #13 | Exceptional 45.1% |
| Immigrants | Scotland | 100.0 /100 | #14 | Exceptional 45.1% |
| Immigrants | Sweden | 100.0 /100 | #15 | Exceptional 45.1% |
| Immigrants | Northern Europe | 100.0 /100 | #16 | Exceptional 45.2% |
| Immigrants | India | 100.0 /100 | #17 | Exceptional 45.2% |
| Bolivians | 100.0 /100 | #18 | Exceptional 45.2% |
| Immigrants | Greece | 100.0 /100 | #19 | Exceptional 45.2% |
| Immigrants | Serbia | 100.0 /100 | #20 | Exceptional 45.3% |
Demographics Similar to Cambodians by Disability Age Over 75
In terms of disability age over 75, the demographic groups most similar to Cambodians are Immigrants from Hungary (46.1%, a difference of 0.020%), Egyptian (46.1%, a difference of 0.040%), Immigrants from Sri Lanka (46.1%, a difference of 0.050%), Jordanian (46.1%, a difference of 0.080%), and Serbian (46.1%, a difference of 0.080%).
| Demographics | Rating | Rank | Disability Age Over 75 |
| Immigrants | England | 99.5 /100 | #66 | Exceptional 46.0% |
| Immigrants | Spain | 99.4 /100 | #67 | Exceptional 46.0% |
| Immigrants | South Central Asia | 99.4 /100 | #68 | Exceptional 46.0% |
| Immigrants | Romania | 99.3 /100 | #69 | Exceptional 46.0% |
| Jordanians | 99.2 /100 | #70 | Exceptional 46.1% |
| Immigrants | Sri Lanka | 99.2 /100 | #71 | Exceptional 46.1% |
| Immigrants | Hungary | 99.1 /100 | #72 | Exceptional 46.1% |
| Cambodians | 99.1 /100 | #73 | Exceptional 46.1% |
| Egyptians | 99.0 /100 | #74 | Exceptional 46.1% |
| Serbians | 99.0 /100 | #75 | Exceptional 46.1% |
| Slavs | 98.9 /100 | #76 | Exceptional 46.1% |
| Immigrants | Eastern Asia | 98.9 /100 | #77 | Exceptional 46.2% |
| Immigrants | Western Europe | 98.8 /100 | #78 | Exceptional 46.2% |
| Swiss | 98.8 /100 | #79 | Exceptional 46.2% |
| Soviet Union | 98.8 /100 | #80 | Exceptional 46.2% |