Lebanese vs Nonimmigrants Disability Age Over 75
COMPARE
Lebanese
Nonimmigrants
Disability Age Over 75
Disability Age Over 75 Comparison
Lebanese
Nonimmigrants
46.8%
DISABILITY AGE OVER 75
87.0/ 100
METRIC RATING
141st/ 347
METRIC RANK
48.0%
DISABILITY AGE OVER 75
6.5/ 100
METRIC RATING
226th/ 347
METRIC RANK
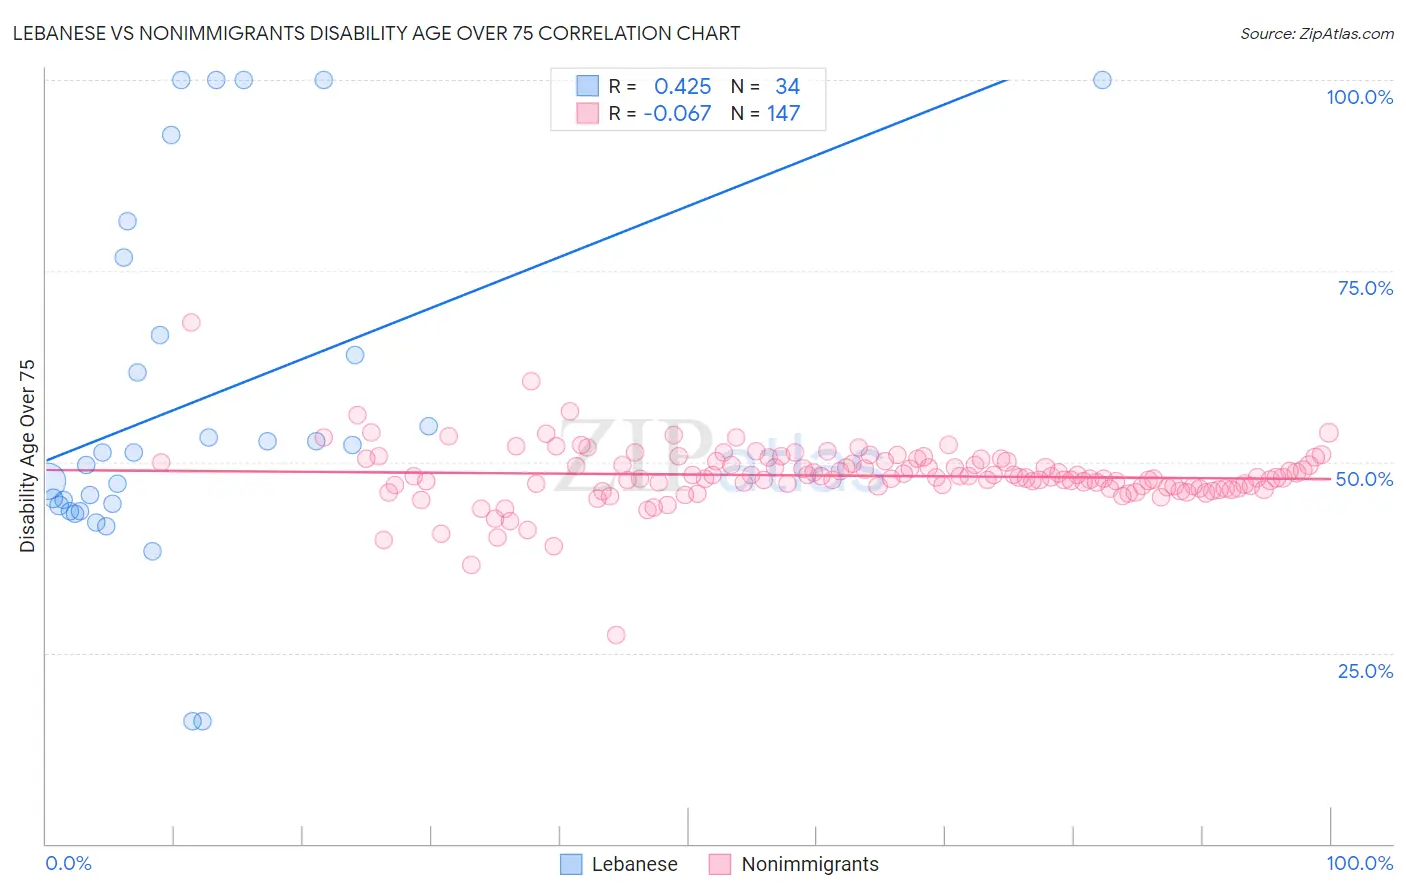
Lebanese vs Nonimmigrants Disability Age Over 75 Correlation Chart
The statistical analysis conducted on geographies consisting of 400,844,308 people shows a moderate positive correlation between the proportion of Lebanese and percentage of population with a disability over the age of 75 in the United States with a correlation coefficient (R) of 0.425 and weighted average of 46.8%. Similarly, the statistical analysis conducted on geographies consisting of 582,018,698 people shows a slight negative correlation between the proportion of Nonimmigrants and percentage of population with a disability over the age of 75 in the United States with a correlation coefficient (R) of -0.067 and weighted average of 48.0%, a difference of 2.6%.
Disability Age Over 75 Correlation Summary
| Measurement | Lebanese | Nonimmigrants |
| Minimum | 16.1% | 27.4% |
| Maximum | 100.0% | 68.2% |
| Range | 83.9% | 40.9% |
| Mean | 57.8% | 48.2% |
| Median | 51.2% | 47.9% |
| Interquartile 25% (IQ1) | 44.3% | 46.7% |
| Interquartile 75% (IQ3) | 66.7% | 50.0% |
| Interquartile Range (IQR) | 22.4% | 3.3% |
| Standard Deviation (Sample) | 23.0% | 4.0% |
| Standard Deviation (Population) | 22.7% | 4.0% |
Similar Demographics by Disability Age Over 75
Demographics Similar to Lebanese by Disability Age Over 75
In terms of disability age over 75, the demographic groups most similar to Lebanese are Immigrants from Costa Rica (46.8%, a difference of 0.020%), Peruvian (46.8%, a difference of 0.020%), Bermudan (46.9%, a difference of 0.070%), Immigrants from Uganda (46.8%, a difference of 0.080%), and Immigrants from Bosnia and Herzegovina (46.8%, a difference of 0.080%).
| Demographics | Rating | Rank | Disability Age Over 75 |
| Immigrants | Ethiopia | 89.1 /100 | #134 | Excellent 46.8% |
| Ethiopians | 88.9 /100 | #135 | Excellent 46.8% |
| Immigrants | Venezuela | 88.6 /100 | #136 | Excellent 46.8% |
| Immigrants | Uganda | 88.5 /100 | #137 | Excellent 46.8% |
| Immigrants | Bosnia and Herzegovina | 88.5 /100 | #138 | Excellent 46.8% |
| Yugoslavians | 88.5 /100 | #139 | Excellent 46.8% |
| Immigrants | Costa Rica | 87.4 /100 | #140 | Excellent 46.8% |
| Lebanese | 87.0 /100 | #141 | Excellent 46.8% |
| Peruvians | 86.5 /100 | #142 | Excellent 46.8% |
| Bermudans | 85.6 /100 | #143 | Excellent 46.9% |
| Venezuelans | 85.0 /100 | #144 | Excellent 46.9% |
| Costa Ricans | 84.5 /100 | #145 | Excellent 46.9% |
| Guyanese | 84.3 /100 | #146 | Excellent 46.9% |
| Immigrants | Peru | 84.1 /100 | #147 | Excellent 46.9% |
| Asians | 81.6 /100 | #148 | Excellent 46.9% |
Demographics Similar to Nonimmigrants by Disability Age Over 75
In terms of disability age over 75, the demographic groups most similar to Nonimmigrants are Spanish (48.0%, a difference of 0.010%), Zimbabwean (48.1%, a difference of 0.010%), Liberian (48.0%, a difference of 0.020%), Barbadian (48.0%, a difference of 0.030%), and Immigrants from Bangladesh (48.0%, a difference of 0.030%).
| Demographics | Rating | Rank | Disability Age Over 75 |
| Immigrants | Western Asia | 7.5 /100 | #219 | Tragic 48.0% |
| Bahamians | 7.4 /100 | #220 | Tragic 48.0% |
| Immigrants | Oceania | 7.3 /100 | #221 | Tragic 48.0% |
| Barbadians | 6.8 /100 | #222 | Tragic 48.0% |
| Immigrants | Bangladesh | 6.8 /100 | #223 | Tragic 48.0% |
| Liberians | 6.7 /100 | #224 | Tragic 48.0% |
| Spanish | 6.5 /100 | #225 | Tragic 48.0% |
| Immigrants | Nonimmigrants | 6.5 /100 | #226 | Tragic 48.0% |
| Zimbabweans | 6.4 /100 | #227 | Tragic 48.1% |
| Immigrants | Liberia | 5.9 /100 | #228 | Tragic 48.1% |
| Spaniards | 5.7 /100 | #229 | Tragic 48.1% |
| Taiwanese | 4.4 /100 | #230 | Tragic 48.2% |
| Immigrants | Immigrants | 4.3 /100 | #231 | Tragic 48.2% |
| Indonesians | 4.2 /100 | #232 | Tragic 48.2% |
| Cree | 4.2 /100 | #233 | Tragic 48.2% |