Immigrants from Eritrea vs Immigrants from Congo Disability Age 65 to 74
COMPARE
Immigrants from Eritrea
Immigrants from Congo
Disability Age 65 to 74
Disability Age 65 to 74 Comparison
Immigrants from Eritrea
Immigrants from Congo
23.4%
DISABILITY AGE 65 TO 74
47.5/ 100
METRIC RATING
176th/ 347
METRIC RANK
26.0%
DISABILITY AGE 65 TO 74
0.0/ 100
METRIC RATING
285th/ 347
METRIC RANK
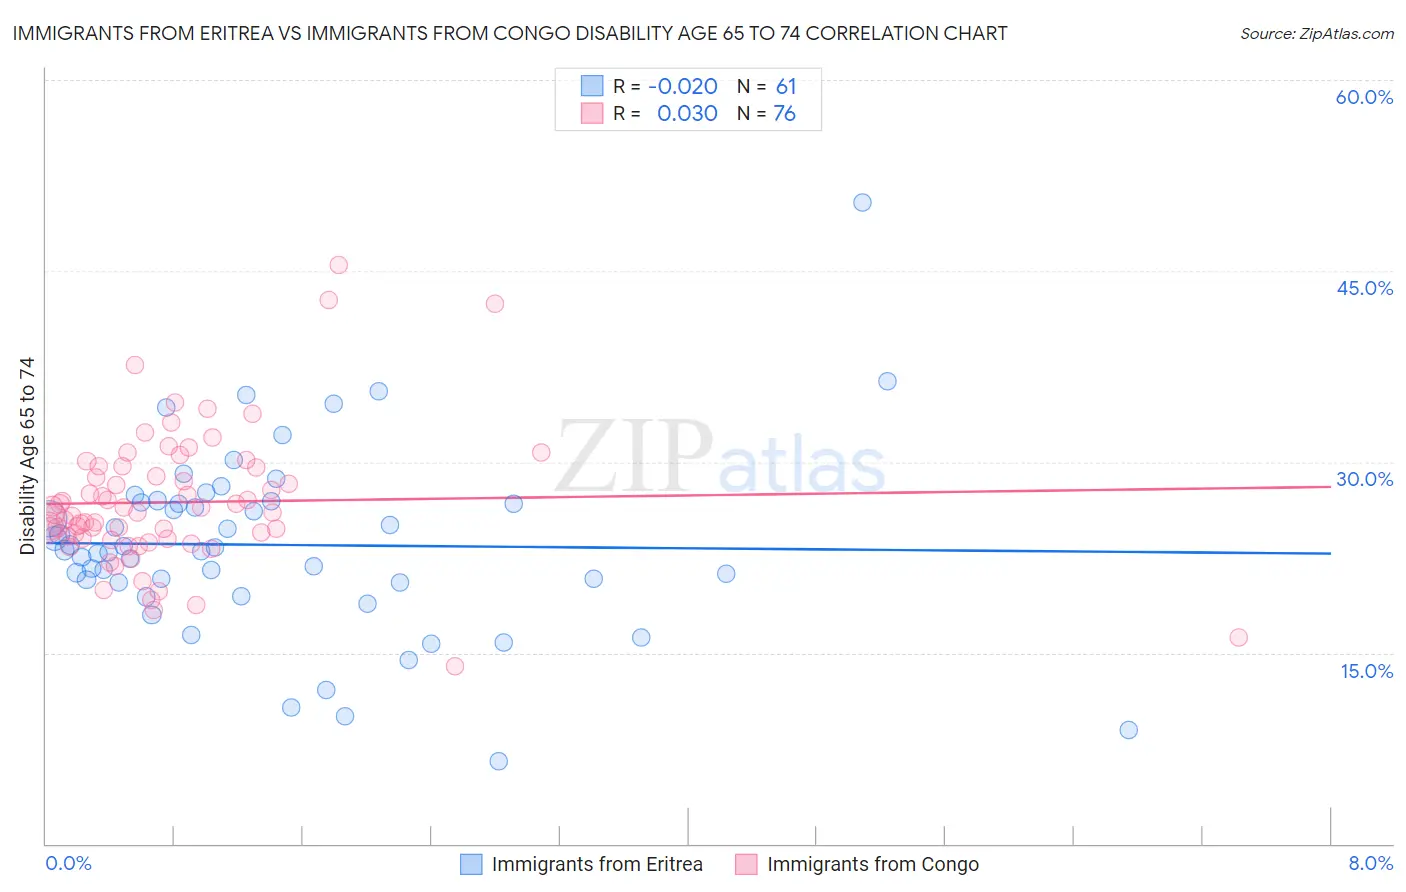
Immigrants from Eritrea vs Immigrants from Congo Disability Age 65 to 74 Correlation Chart
The statistical analysis conducted on geographies consisting of 104,842,902 people shows no correlation between the proportion of Immigrants from Eritrea and percentage of population with a disability between the ages 65 and 75 in the United States with a correlation coefficient (R) of -0.020 and weighted average of 23.4%. Similarly, the statistical analysis conducted on geographies consisting of 92,066,096 people shows no correlation between the proportion of Immigrants from Congo and percentage of population with a disability between the ages 65 and 75 in the United States with a correlation coefficient (R) of 0.030 and weighted average of 26.0%, a difference of 11.2%.
Disability Age 65 to 74 Correlation Summary
| Measurement | Immigrants from Eritrea | Immigrants from Congo |
| Minimum | 6.5% | 14.0% |
| Maximum | 50.4% | 45.5% |
| Range | 43.9% | 31.5% |
| Mean | 23.5% | 26.8% |
| Median | 23.1% | 26.1% |
| Interquartile 25% (IQ1) | 20.5% | 24.0% |
| Interquartile 75% (IQ3) | 26.9% | 29.6% |
| Interquartile Range (IQR) | 6.4% | 5.6% |
| Standard Deviation (Sample) | 7.3% | 5.4% |
| Standard Deviation (Population) | 7.2% | 5.4% |
Similar Demographics by Disability Age 65 to 74
Demographics Similar to Immigrants from Eritrea by Disability Age 65 to 74
In terms of disability age 65 to 74, the demographic groups most similar to Immigrants from Eritrea are Immigrants from Haiti (23.4%, a difference of 0.0%), Guyanese (23.4%, a difference of 0.10%), Immigrants from Sierra Leone (23.4%, a difference of 0.10%), Dutch (23.3%, a difference of 0.11%), and Scandinavian (23.4%, a difference of 0.12%).
| Demographics | Rating | Rank | Disability Age 65 to 74 |
| Icelanders | 54.3 /100 | #169 | Average 23.3% |
| Moroccans | 54.2 /100 | #170 | Average 23.3% |
| Cubans | 51.9 /100 | #171 | Average 23.3% |
| Germans | 50.5 /100 | #172 | Average 23.3% |
| Yugoslavians | 50.2 /100 | #173 | Average 23.3% |
| Immigrants | South Eastern Asia | 50.0 /100 | #174 | Average 23.3% |
| Dutch | 49.4 /100 | #175 | Average 23.3% |
| Immigrants | Eritrea | 47.5 /100 | #176 | Average 23.4% |
| Immigrants | Haiti | 47.5 /100 | #177 | Average 23.4% |
| Guyanese | 45.8 /100 | #178 | Average 23.4% |
| Immigrants | Sierra Leone | 45.8 /100 | #179 | Average 23.4% |
| Scandinavians | 45.6 /100 | #180 | Average 23.4% |
| Assyrians/Chaldeans/Syriacs | 45.3 /100 | #181 | Average 23.4% |
| Irish | 44.4 /100 | #182 | Average 23.4% |
| Immigrants | Eastern Africa | 42.8 /100 | #183 | Average 23.4% |
Demographics Similar to Immigrants from Congo by Disability Age 65 to 74
In terms of disability age 65 to 74, the demographic groups most similar to Immigrants from Congo are Immigrants from the Azores (26.0%, a difference of 0.020%), Spanish American (25.9%, a difference of 0.21%), Delaware (25.9%, a difference of 0.35%), Immigrants from Honduras (25.9%, a difference of 0.42%), and Immigrants from Micronesia (26.1%, a difference of 0.43%).
| Demographics | Rating | Rank | Disability Age 65 to 74 |
| Immigrants | Belize | 0.1 /100 | #278 | Tragic 25.8% |
| U.S. Virgin Islanders | 0.1 /100 | #279 | Tragic 25.9% |
| Cree | 0.1 /100 | #280 | Tragic 25.9% |
| Immigrants | Honduras | 0.1 /100 | #281 | Tragic 25.9% |
| Delaware | 0.1 /100 | #282 | Tragic 25.9% |
| Spanish Americans | 0.0 /100 | #283 | Tragic 25.9% |
| Immigrants | Azores | 0.0 /100 | #284 | Tragic 26.0% |
| Immigrants | Congo | 0.0 /100 | #285 | Tragic 26.0% |
| Immigrants | Micronesia | 0.0 /100 | #286 | Tragic 26.1% |
| Immigrants | Laos | 0.0 /100 | #287 | Tragic 26.1% |
| Mexican American Indians | 0.0 /100 | #288 | Tragic 26.2% |
| Africans | 0.0 /100 | #289 | Tragic 26.2% |
| Immigrants | Cabo Verde | 0.0 /100 | #290 | Tragic 26.3% |
| Spanish American Indians | 0.0 /100 | #291 | Tragic 26.4% |
| Blackfeet | 0.0 /100 | #292 | Tragic 26.6% |