Immigrants from Zaire vs Immigrants from Brazil Self-Care Disability
COMPARE
Immigrants from Zaire
Immigrants from Brazil
Self-Care Disability
Self-Care Disability Comparison
Immigrants from Zaire
Immigrants from Brazil
2.3%
SELF-CARE DISABILITY
99.2/ 100
METRIC RATING
68th/ 347
METRIC RANK
2.3%
SELF-CARE DISABILITY
99.7/ 100
METRIC RATING
50th/ 347
METRIC RANK
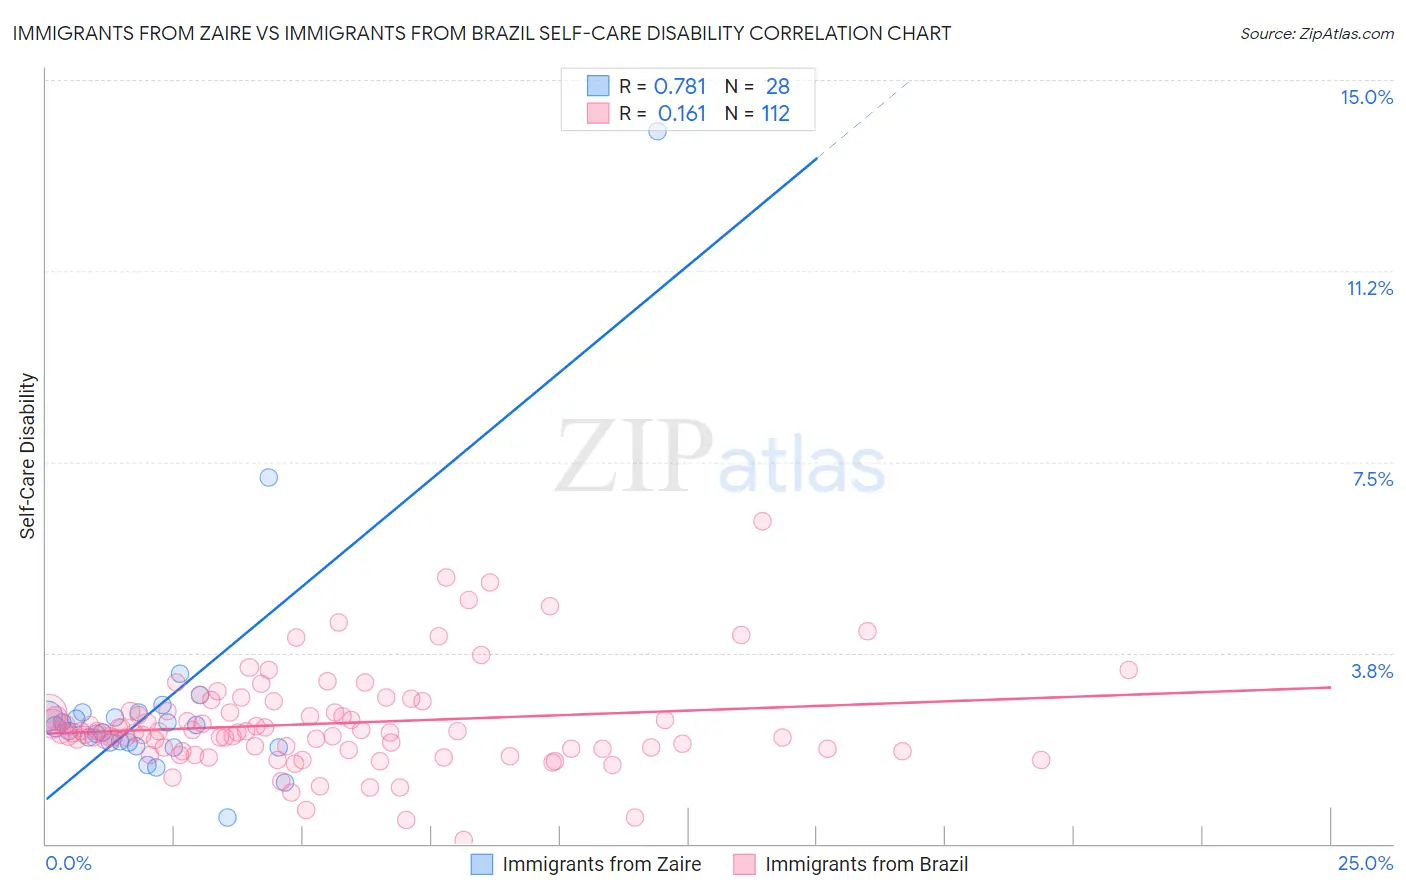
Immigrants from Zaire vs Immigrants from Brazil Self-Care Disability Correlation Chart
The statistical analysis conducted on geographies consisting of 107,230,784 people shows a strong positive correlation between the proportion of Immigrants from Zaire and percentage of population with self-care disability in the United States with a correlation coefficient (R) of 0.781 and weighted average of 2.3%. Similarly, the statistical analysis conducted on geographies consisting of 342,700,860 people shows a poor positive correlation between the proportion of Immigrants from Brazil and percentage of population with self-care disability in the United States with a correlation coefficient (R) of 0.161 and weighted average of 2.3%, a difference of 1.2%.
Self-Care Disability Correlation Summary
| Measurement | Immigrants from Zaire | Immigrants from Brazil |
| Minimum | 0.51% | 0.076% |
| Maximum | 14.0% | 6.3% |
| Range | 13.5% | 6.3% |
| Mean | 2.8% | 2.4% |
| Median | 2.3% | 2.2% |
| Interquartile 25% (IQ1) | 1.9% | 1.9% |
| Interquartile 75% (IQ3) | 2.5% | 2.6% |
| Interquartile Range (IQR) | 0.59% | 0.73% |
| Standard Deviation (Sample) | 2.5% | 0.97% |
| Standard Deviation (Population) | 2.4% | 0.97% |
Demographics Similar to Immigrants from Zaire and Immigrants from Brazil by Self-Care Disability
In terms of self-care disability, the demographic groups most similar to Immigrants from Zaire are Immigrants from Norway (2.3%, a difference of 0.0%), South African (2.3%, a difference of 0.090%), Immigrants from Argentina (2.3%, a difference of 0.12%), Brazilian (2.3%, a difference of 0.15%), and Swedish (2.3%, a difference of 0.21%). Similarly, the demographic groups most similar to Immigrants from Brazil are Latvian (2.3%, a difference of 0.020%), Kenyan (2.3%, a difference of 0.15%), Immigrants from Serbia (2.3%, a difference of 0.17%), Australian (2.3%, a difference of 0.20%), and Argentinean (2.3%, a difference of 0.25%).
| Demographics | Rating | Rank | Self-Care Disability |
| Latvians | 99.7 /100 | #49 | Exceptional 2.3% |
| Immigrants | Brazil | 99.7 /100 | #50 | Exceptional 2.3% |
| Kenyans | 99.7 /100 | #51 | Exceptional 2.3% |
| Immigrants | Serbia | 99.6 /100 | #52 | Exceptional 2.3% |
| Australians | 99.6 /100 | #53 | Exceptional 2.3% |
| Argentineans | 99.6 /100 | #54 | Exceptional 2.3% |
| Immigrants | France | 99.6 /100 | #55 | Exceptional 2.3% |
| Immigrants | Eastern Asia | 99.6 /100 | #56 | Exceptional 2.3% |
| Immigrants | Belgium | 99.6 /100 | #57 | Exceptional 2.3% |
| Immigrants | Cameroon | 99.6 /100 | #58 | Exceptional 2.3% |
| New Zealanders | 99.5 /100 | #59 | Exceptional 2.3% |
| Immigrants | Japan | 99.5 /100 | #60 | Exceptional 2.3% |
| Palestinians | 99.4 /100 | #61 | Exceptional 2.3% |
| Egyptians | 99.4 /100 | #62 | Exceptional 2.3% |
| Mongolians | 99.3 /100 | #63 | Exceptional 2.3% |
| Swedes | 99.3 /100 | #64 | Exceptional 2.3% |
| Brazilians | 99.3 /100 | #65 | Exceptional 2.3% |
| Immigrants | Argentina | 99.3 /100 | #66 | Exceptional 2.3% |
| South Africans | 99.3 /100 | #67 | Exceptional 2.3% |
| Immigrants | Zaire | 99.2 /100 | #68 | Exceptional 2.3% |
| Immigrants | Norway | 99.2 /100 | #69 | Exceptional 2.3% |