Immigrants from Western Europe vs Basque Cognitive Disability
COMPARE
Immigrants from Western Europe
Basque
Cognitive Disability
Cognitive Disability Comparison
Immigrants from Western Europe
Basques
16.9%
COGNITIVE DISABILITY
94.8/ 100
METRIC RATING
122nd/ 347
METRIC RANK
17.1%
COGNITIVE DISABILITY
85.5/ 100
METRIC RATING
150th/ 347
METRIC RANK
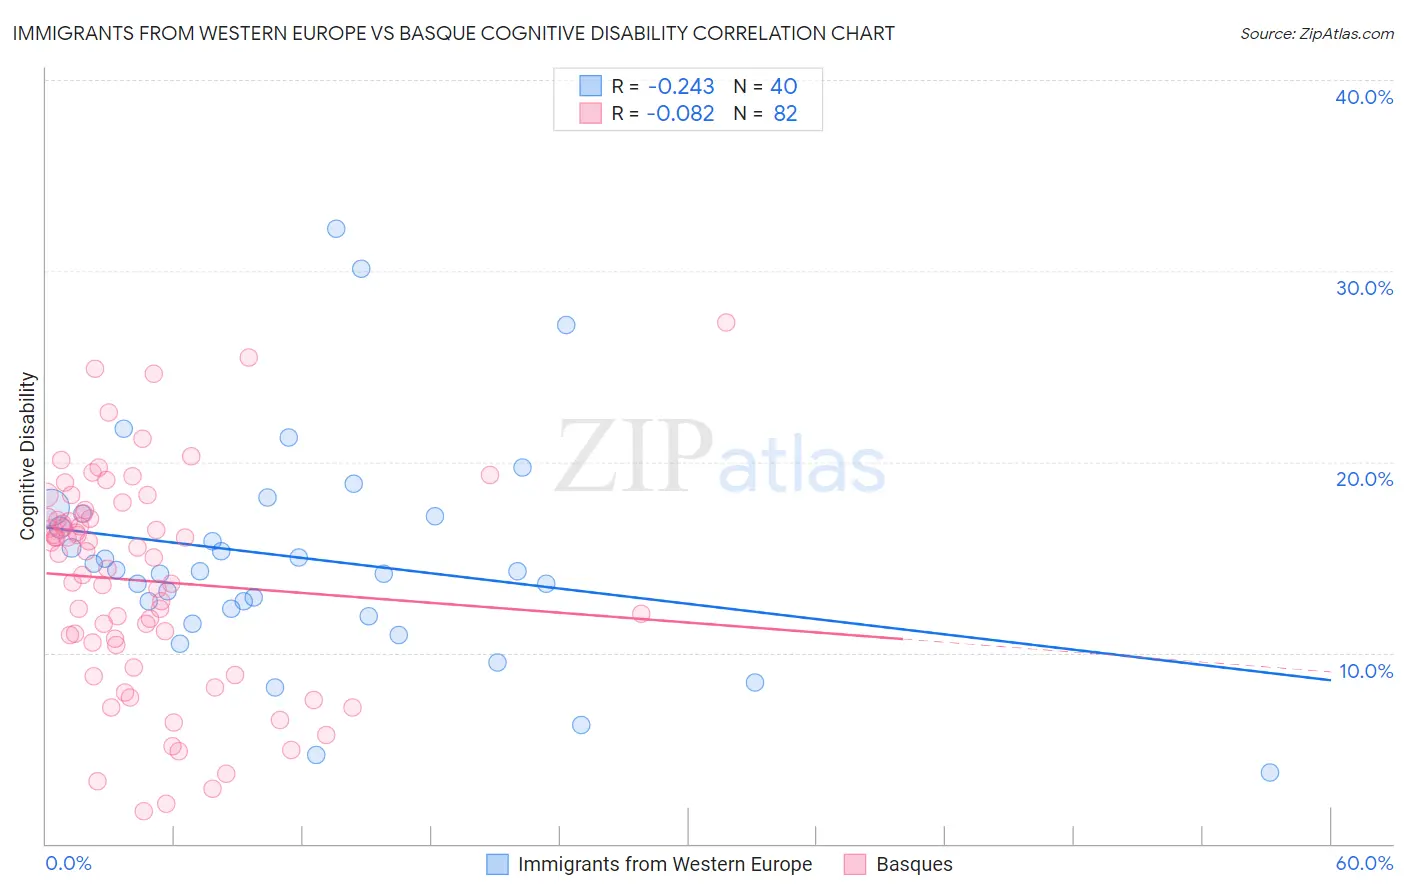
Immigrants from Western Europe vs Basque Cognitive Disability Correlation Chart
The statistical analysis conducted on geographies consisting of 494,034,294 people shows a weak negative correlation between the proportion of Immigrants from Western Europe and percentage of population with cognitive disability in the United States with a correlation coefficient (R) of -0.243 and weighted average of 16.9%. Similarly, the statistical analysis conducted on geographies consisting of 165,778,299 people shows a slight negative correlation between the proportion of Basques and percentage of population with cognitive disability in the United States with a correlation coefficient (R) of -0.082 and weighted average of 17.1%, a difference of 0.82%.
Cognitive Disability Correlation Summary
| Measurement | Immigrants from Western Europe | Basque |
| Minimum | 3.8% | 1.7% |
| Maximum | 32.2% | 27.3% |
| Range | 28.4% | 25.6% |
| Mean | 14.9% | 13.8% |
| Median | 14.3% | 15.1% |
| Interquartile 25% (IQ1) | 12.1% | 10.4% |
| Interquartile 75% (IQ3) | 17.2% | 17.1% |
| Interquartile Range (IQR) | 5.1% | 6.7% |
| Standard Deviation (Sample) | 5.9% | 5.7% |
| Standard Deviation (Population) | 5.8% | 5.6% |
Similar Demographics by Cognitive Disability
Demographics Similar to Immigrants from Western Europe by Cognitive Disability
In terms of cognitive disability, the demographic groups most similar to Immigrants from Western Europe are Portuguese (16.9%, a difference of 0.010%), Immigrants from China (16.9%, a difference of 0.020%), Scottish (16.9%, a difference of 0.030%), Turkish (16.9%, a difference of 0.030%), and Scandinavian (16.9%, a difference of 0.090%).
| Demographics | Rating | Rank | Cognitive Disability |
| Yup'ik | 96.9 /100 | #115 | Exceptional 16.9% |
| Inupiat | 96.5 /100 | #116 | Exceptional 16.9% |
| Immigrants | Japan | 96.2 /100 | #117 | Exceptional 16.9% |
| Immigrants | Denmark | 96.2 /100 | #118 | Exceptional 16.9% |
| South Africans | 95.5 /100 | #119 | Exceptional 16.9% |
| Scottish | 95.0 /100 | #120 | Exceptional 16.9% |
| Immigrants | China | 94.9 /100 | #121 | Exceptional 16.9% |
| Immigrants | Western Europe | 94.8 /100 | #122 | Exceptional 16.9% |
| Portuguese | 94.7 /100 | #123 | Exceptional 16.9% |
| Turks | 94.5 /100 | #124 | Exceptional 16.9% |
| Scandinavians | 94.1 /100 | #125 | Exceptional 16.9% |
| Europeans | 93.4 /100 | #126 | Exceptional 17.0% |
| Immigrants | Costa Rica | 93.1 /100 | #127 | Exceptional 17.0% |
| Nicaraguans | 93.0 /100 | #128 | Exceptional 17.0% |
| Immigrants | Uruguay | 92.9 /100 | #129 | Exceptional 17.0% |
Demographics Similar to Basques by Cognitive Disability
In terms of cognitive disability, the demographic groups most similar to Basques are French Canadian (17.1%, a difference of 0.010%), Cypriot (17.1%, a difference of 0.010%), Scotch-Irish (17.1%, a difference of 0.030%), Syrian (17.1%, a difference of 0.13%), and Immigrants from Indonesia (17.1%, a difference of 0.15%).
| Demographics | Rating | Rank | Cognitive Disability |
| British | 89.3 /100 | #143 | Excellent 17.0% |
| Immigrants | Brazil | 89.3 /100 | #144 | Excellent 17.0% |
| Immigrants | South Eastern Asia | 88.7 /100 | #145 | Excellent 17.0% |
| Costa Ricans | 88.0 /100 | #146 | Excellent 17.0% |
| Scotch-Irish | 85.9 /100 | #147 | Excellent 17.1% |
| French Canadians | 85.7 /100 | #148 | Excellent 17.1% |
| Cypriots | 85.7 /100 | #149 | Excellent 17.1% |
| Basques | 85.5 /100 | #150 | Excellent 17.1% |
| Syrians | 83.0 /100 | #151 | Excellent 17.1% |
| Immigrants | Indonesia | 82.7 /100 | #152 | Excellent 17.1% |
| Immigrants | Kazakhstan | 80.5 /100 | #153 | Excellent 17.1% |
| Immigrants | Malaysia | 79.3 /100 | #154 | Good 17.1% |
| Brazilians | 78.9 /100 | #155 | Good 17.1% |
| Sri Lankans | 78.9 /100 | #156 | Good 17.1% |
| Immigrants | Australia | 76.0 /100 | #157 | Good 17.1% |