Immigrants from Western Europe vs Basque 3rd Grade
COMPARE
Immigrants from Western Europe
Basque
3rd Grade
3rd Grade Comparison
Immigrants from Western Europe
Basques
98.1%
3RD GRADE
98.7/ 100
METRIC RATING
93rd/ 347
METRIC RANK
98.0%
3RD GRADE
96.5/ 100
METRIC RATING
111th/ 347
METRIC RANK
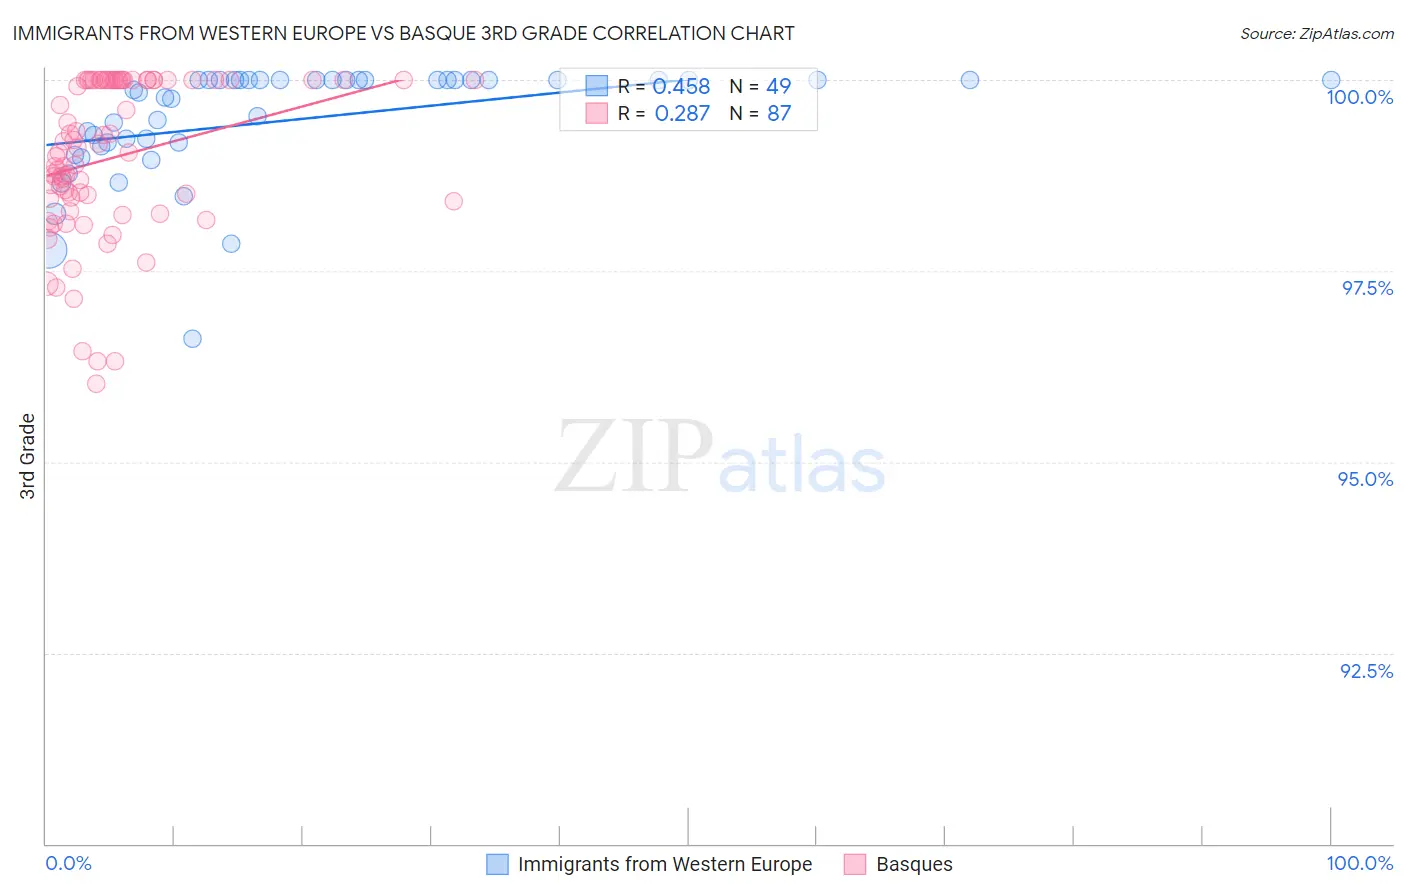
Immigrants from Western Europe vs Basque 3rd Grade Correlation Chart
The statistical analysis conducted on geographies consisting of 494,080,297 people shows a moderate positive correlation between the proportion of Immigrants from Western Europe and percentage of population with at least 3rd grade education in the United States with a correlation coefficient (R) of 0.458 and weighted average of 98.1%. Similarly, the statistical analysis conducted on geographies consisting of 165,774,137 people shows a weak positive correlation between the proportion of Basques and percentage of population with at least 3rd grade education in the United States with a correlation coefficient (R) of 0.287 and weighted average of 98.0%, a difference of 0.090%.
3rd Grade Correlation Summary
| Measurement | Immigrants from Western Europe | Basque |
| Minimum | 96.6% | 96.0% |
| Maximum | 100.0% | 100.0% |
| Range | 3.4% | 4.0% |
| Mean | 99.5% | 99.0% |
| Median | 99.9% | 99.1% |
| Interquartile 25% (IQ1) | 99.2% | 98.4% |
| Interquartile 75% (IQ3) | 100.0% | 100.0% |
| Interquartile Range (IQR) | 0.84% | 1.6% |
| Standard Deviation (Sample) | 0.74% | 1.0% |
| Standard Deviation (Population) | 0.73% | 1.0% |
Demographics Similar to Immigrants from Western Europe and Basques by 3rd Grade
In terms of 3rd grade, the demographic groups most similar to Immigrants from Western Europe are Immigrants from South Africa (98.1%, a difference of 0.0%), Immigrants from Germany (98.1%, a difference of 0.020%), Cypriot (98.1%, a difference of 0.020%), Immigrants from Ireland (98.1%, a difference of 0.030%), and South African (98.1%, a difference of 0.030%). Similarly, the demographic groups most similar to Basques are Immigrants from Switzerland (98.0%, a difference of 0.0%), Immigrants from Czechoslovakia (98.0%, a difference of 0.010%), Immigrants from Singapore (98.0%, a difference of 0.010%), Pima (98.0%, a difference of 0.010%), and Immigrants from Latvia (98.0%, a difference of 0.010%).
| Demographics | Rating | Rank | 3rd Grade |
| Immigrants | South Africa | 98.7 /100 | #92 | Exceptional 98.1% |
| Immigrants | Western Europe | 98.7 /100 | #93 | Exceptional 98.1% |
| Immigrants | Germany | 98.4 /100 | #94 | Exceptional 98.1% |
| Cypriots | 98.4 /100 | #95 | Exceptional 98.1% |
| Immigrants | Ireland | 98.2 /100 | #96 | Exceptional 98.1% |
| South Africans | 98.2 /100 | #97 | Exceptional 98.1% |
| Choctaw | 98.0 /100 | #98 | Exceptional 98.1% |
| Romanians | 98.0 /100 | #99 | Exceptional 98.1% |
| Cree | 97.9 /100 | #100 | Exceptional 98.1% |
| Puget Sound Salish | 97.9 /100 | #101 | Exceptional 98.1% |
| Immigrants | Nonimmigrants | 97.8 /100 | #102 | Exceptional 98.1% |
| Yugoslavians | 97.7 /100 | #103 | Exceptional 98.1% |
| Turks | 97.6 /100 | #104 | Exceptional 98.1% |
| German Russians | 97.2 /100 | #105 | Exceptional 98.1% |
| Bhutanese | 97.2 /100 | #106 | Exceptional 98.1% |
| Immigrants | Czechoslovakia | 97.0 /100 | #107 | Exceptional 98.0% |
| Immigrants | Singapore | 96.7 /100 | #108 | Exceptional 98.0% |
| Pima | 96.7 /100 | #109 | Exceptional 98.0% |
| Immigrants | Switzerland | 96.6 /100 | #110 | Exceptional 98.0% |
| Basques | 96.5 /100 | #111 | Exceptional 98.0% |
| Immigrants | Latvia | 96.0 /100 | #112 | Exceptional 98.0% |