Immigrants from Western Asia vs South American Indian Disability Age 65 to 74
COMPARE
Immigrants from Western Asia
South American Indian
Disability Age 65 to 74
Disability Age 65 to 74 Comparison
Immigrants from Western Asia
South American Indians
23.0%
DISABILITY AGE 65 TO 74
73.8/ 100
METRIC RATING
156th/ 347
METRIC RANK
23.1%
DISABILITY AGE 65 TO 74
65.5/ 100
METRIC RATING
159th/ 347
METRIC RANK
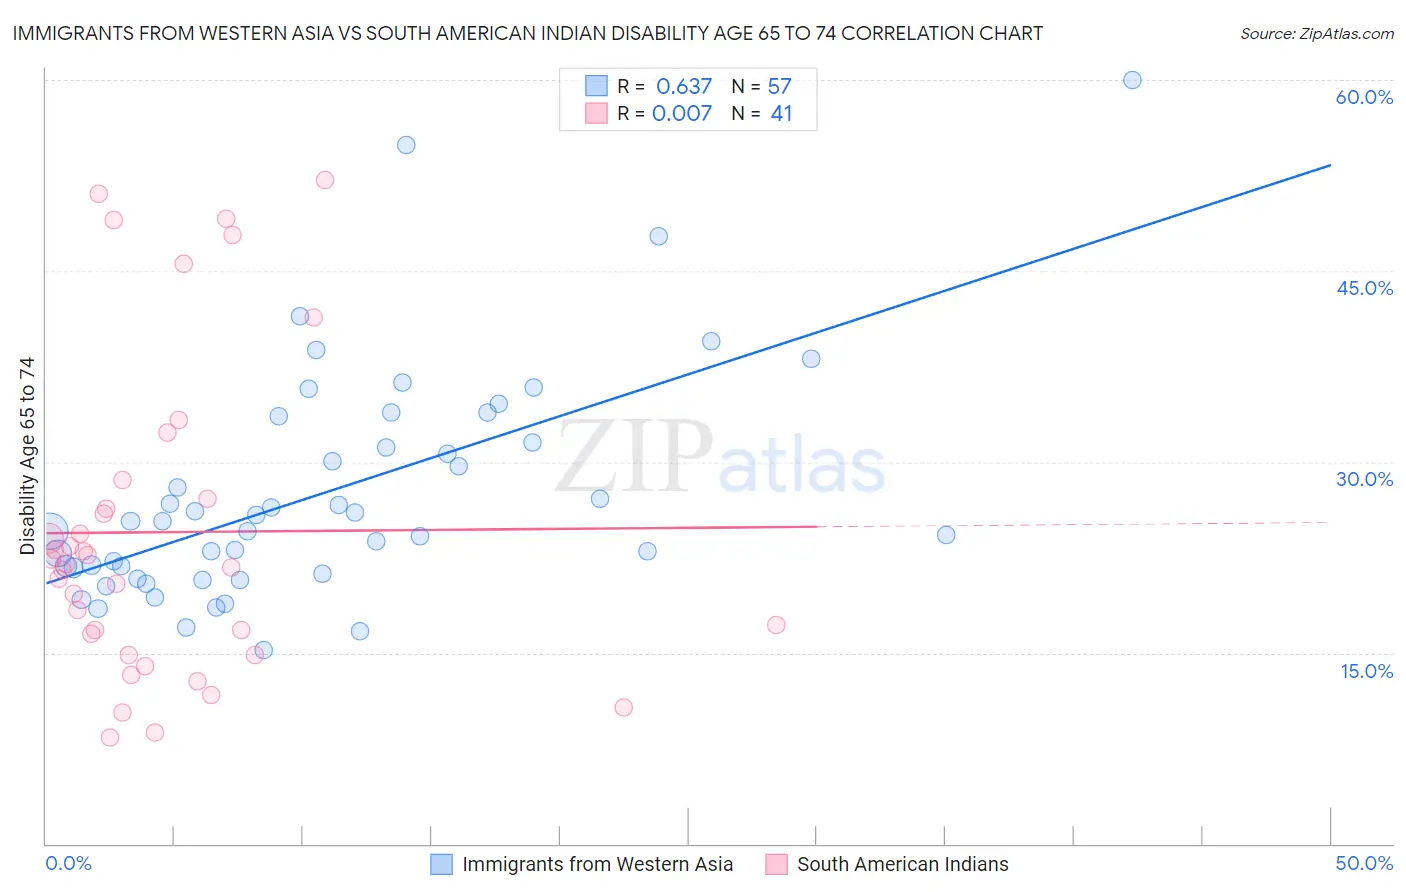
Immigrants from Western Asia vs South American Indian Disability Age 65 to 74 Correlation Chart
The statistical analysis conducted on geographies consisting of 403,742,188 people shows a significant positive correlation between the proportion of Immigrants from Western Asia and percentage of population with a disability between the ages 65 and 75 in the United States with a correlation coefficient (R) of 0.637 and weighted average of 23.0%. Similarly, the statistical analysis conducted on geographies consisting of 164,502,257 people shows no correlation between the proportion of South American Indians and percentage of population with a disability between the ages 65 and 75 in the United States with a correlation coefficient (R) of 0.007 and weighted average of 23.1%, a difference of 0.59%.
Disability Age 65 to 74 Correlation Summary
| Measurement | Immigrants from Western Asia | South American Indian |
| Minimum | 15.2% | 8.3% |
| Maximum | 60.0% | 52.2% |
| Range | 44.8% | 43.8% |
| Mean | 27.6% | 24.5% |
| Median | 25.3% | 22.0% |
| Interquartile 25% (IQ1) | 21.4% | 15.7% |
| Interquartile 75% (IQ3) | 32.5% | 27.9% |
| Interquartile Range (IQR) | 11.1% | 12.2% |
| Standard Deviation (Sample) | 9.0% | 12.4% |
| Standard Deviation (Population) | 9.0% | 12.2% |
Demographics Similar to Immigrants from Western Asia and South American Indians by Disability Age 65 to 74
In terms of disability age 65 to 74, the demographic groups most similar to Immigrants from Western Asia are Sri Lankan (23.0%, a difference of 0.010%), British (23.0%, a difference of 0.010%), Slavic (23.0%, a difference of 0.10%), Czechoslovakian (23.0%, a difference of 0.11%), and Finnish (22.9%, a difference of 0.21%). Similarly, the demographic groups most similar to South American Indians are Korean (23.1%, a difference of 0.090%), Immigrants from Cameroon (23.1%, a difference of 0.11%), Immigrants from Vietnam (23.1%, a difference of 0.24%), European (23.2%, a difference of 0.27%), and Immigrants from Philippines (23.2%, a difference of 0.27%).
| Demographics | Rating | Rank | Disability Age 65 to 74 |
| Immigrants | Uzbekistan | 83.1 /100 | #147 | Excellent 22.8% |
| New Zealanders | 79.9 /100 | #148 | Good 22.9% |
| Swiss | 79.7 /100 | #149 | Good 22.9% |
| Canadians | 77.7 /100 | #150 | Good 22.9% |
| Immigrants | Morocco | 77.6 /100 | #151 | Good 22.9% |
| Finns | 76.5 /100 | #152 | Good 22.9% |
| Slavs | 75.2 /100 | #153 | Good 23.0% |
| Sri Lankans | 74.0 /100 | #154 | Good 23.0% |
| British | 73.9 /100 | #155 | Good 23.0% |
| Immigrants | Western Asia | 73.8 /100 | #156 | Good 23.0% |
| Czechoslovakians | 72.4 /100 | #157 | Good 23.0% |
| Immigrants | Vietnam | 69.1 /100 | #158 | Good 23.1% |
| South American Indians | 65.5 /100 | #159 | Good 23.1% |
| Koreans | 64.2 /100 | #160 | Good 23.1% |
| Immigrants | Cameroon | 63.8 /100 | #161 | Good 23.1% |
| Europeans | 61.2 /100 | #162 | Good 23.2% |
| Immigrants | Philippines | 61.1 /100 | #163 | Good 23.2% |
| Sierra Leoneans | 60.9 /100 | #164 | Good 23.2% |
| Vietnamese | 60.8 /100 | #165 | Good 23.2% |
| Immigrants | Afghanistan | 60.5 /100 | #166 | Good 23.2% |
| Immigrants | Bosnia and Herzegovina | 57.6 /100 | #167 | Average 23.2% |