Immigrants from Haiti vs South American Indian Disability Age 65 to 74
COMPARE
Immigrants from Haiti
South American Indian
Disability Age 65 to 74
Disability Age 65 to 74 Comparison
Immigrants from Haiti
South American Indians
23.4%
DISABILITY AGE 65 TO 74
47.5/ 100
METRIC RATING
177th/ 347
METRIC RANK
23.1%
DISABILITY AGE 65 TO 74
65.5/ 100
METRIC RATING
159th/ 347
METRIC RANK
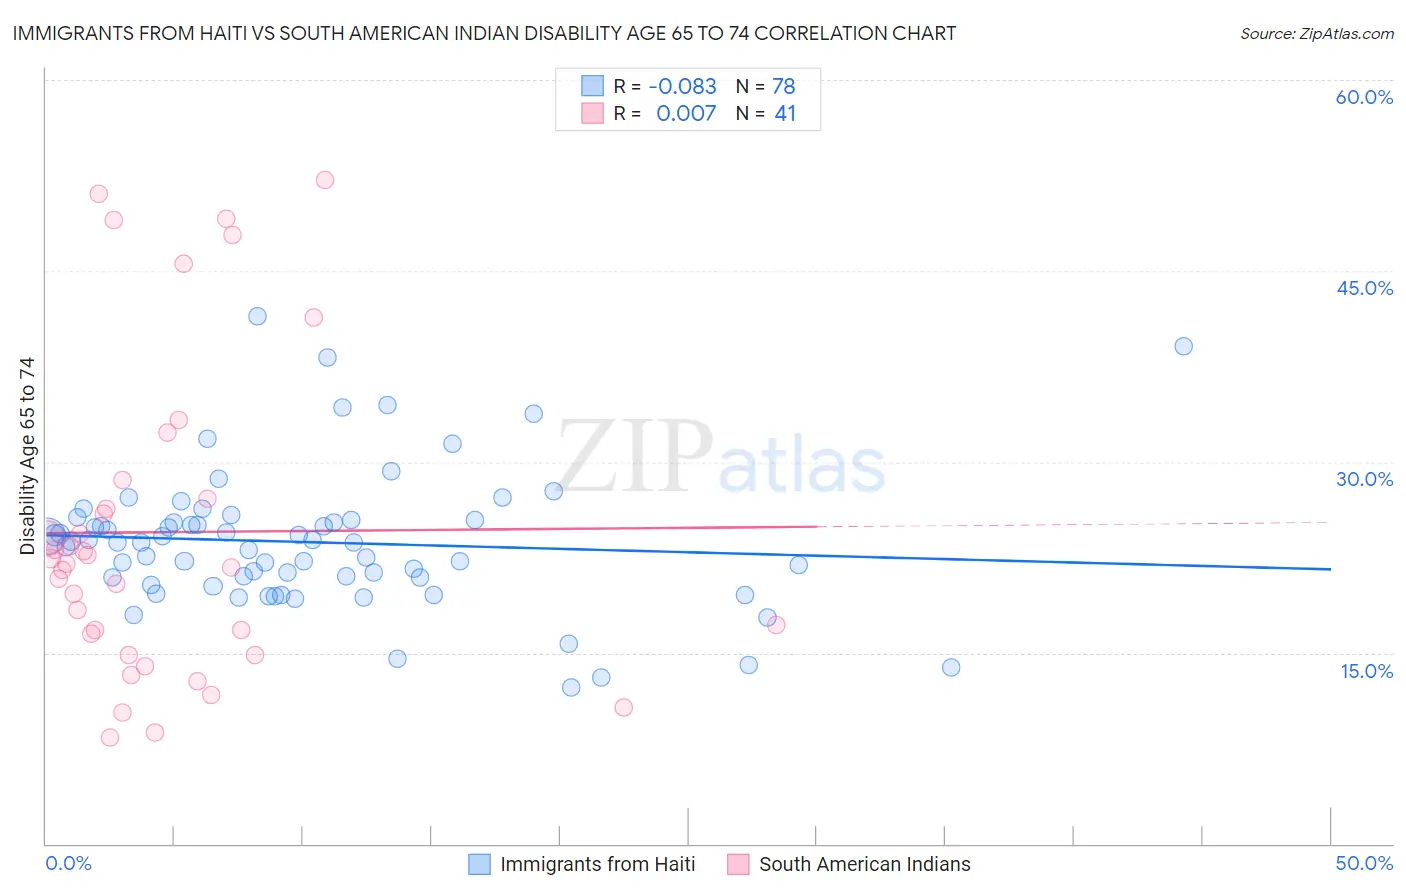
Immigrants from Haiti vs South American Indian Disability Age 65 to 74 Correlation Chart
The statistical analysis conducted on geographies consisting of 224,915,103 people shows a slight negative correlation between the proportion of Immigrants from Haiti and percentage of population with a disability between the ages 65 and 75 in the United States with a correlation coefficient (R) of -0.083 and weighted average of 23.4%. Similarly, the statistical analysis conducted on geographies consisting of 164,502,257 people shows no correlation between the proportion of South American Indians and percentage of population with a disability between the ages 65 and 75 in the United States with a correlation coefficient (R) of 0.007 and weighted average of 23.1%, a difference of 1.1%.
Disability Age 65 to 74 Correlation Summary
| Measurement | Immigrants from Haiti | South American Indian |
| Minimum | 12.3% | 8.3% |
| Maximum | 41.5% | 52.2% |
| Range | 29.2% | 43.8% |
| Mean | 23.7% | 24.5% |
| Median | 23.7% | 22.0% |
| Interquartile 25% (IQ1) | 20.9% | 15.7% |
| Interquartile 75% (IQ3) | 25.4% | 27.9% |
| Interquartile Range (IQR) | 4.6% | 12.2% |
| Standard Deviation (Sample) | 5.4% | 12.4% |
| Standard Deviation (Population) | 5.4% | 12.2% |
Demographics Similar to Immigrants from Haiti and South American Indians by Disability Age 65 to 74
In terms of disability age 65 to 74, the demographic groups most similar to Immigrants from Haiti are Immigrants from Eritrea (23.4%, a difference of 0.0%), Guyanese (23.4%, a difference of 0.10%), Dutch (23.3%, a difference of 0.11%), Immigrants from South Eastern Asia (23.3%, a difference of 0.14%), and Yugoslavian (23.3%, a difference of 0.16%). Similarly, the demographic groups most similar to South American Indians are Korean (23.1%, a difference of 0.090%), Immigrants from Cameroon (23.1%, a difference of 0.11%), Immigrants from Vietnam (23.1%, a difference of 0.24%), European (23.2%, a difference of 0.27%), and Immigrants from Philippines (23.2%, a difference of 0.27%).
| Demographics | Rating | Rank | Disability Age 65 to 74 |
| Immigrants | Vietnam | 69.1 /100 | #158 | Good 23.1% |
| South American Indians | 65.5 /100 | #159 | Good 23.1% |
| Koreans | 64.2 /100 | #160 | Good 23.1% |
| Immigrants | Cameroon | 63.8 /100 | #161 | Good 23.1% |
| Europeans | 61.2 /100 | #162 | Good 23.2% |
| Immigrants | Philippines | 61.1 /100 | #163 | Good 23.2% |
| Sierra Leoneans | 60.9 /100 | #164 | Good 23.2% |
| Vietnamese | 60.8 /100 | #165 | Good 23.2% |
| Immigrants | Afghanistan | 60.5 /100 | #166 | Good 23.2% |
| Immigrants | Bosnia and Herzegovina | 57.6 /100 | #167 | Average 23.2% |
| Pakistanis | 57.0 /100 | #168 | Average 23.2% |
| Icelanders | 54.3 /100 | #169 | Average 23.3% |
| Moroccans | 54.2 /100 | #170 | Average 23.3% |
| Cubans | 51.9 /100 | #171 | Average 23.3% |
| Germans | 50.5 /100 | #172 | Average 23.3% |
| Yugoslavians | 50.2 /100 | #173 | Average 23.3% |
| Immigrants | South Eastern Asia | 50.0 /100 | #174 | Average 23.3% |
| Dutch | 49.4 /100 | #175 | Average 23.3% |
| Immigrants | Eritrea | 47.5 /100 | #176 | Average 23.4% |
| Immigrants | Haiti | 47.5 /100 | #177 | Average 23.4% |
| Guyanese | 45.8 /100 | #178 | Average 23.4% |