Immigrants from Western Asia vs Immigrants from Haiti Disability Age 18 to 34
COMPARE
Immigrants from Western Asia
Immigrants from Haiti
Disability Age 18 to 34
Disability Age 18 to 34 Comparison
Immigrants from Western Asia
Immigrants from Haiti
6.1%
DISABILITY AGE 18 TO 34
98.9/ 100
METRIC RATING
76th/ 347
METRIC RANK
5.9%
DISABILITY AGE 18 TO 34
99.7/ 100
METRIC RATING
57th/ 347
METRIC RANK
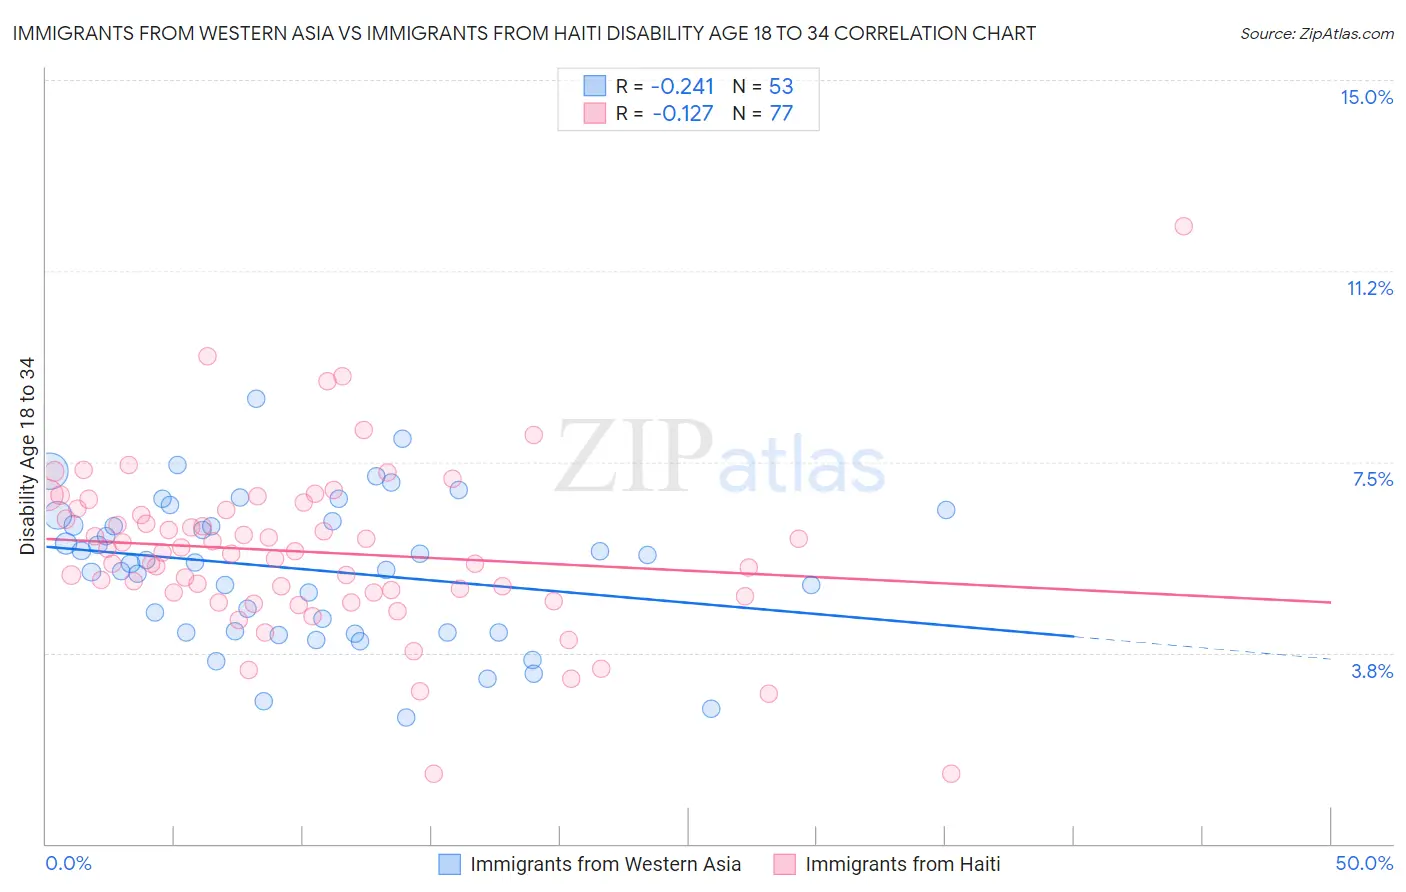
Immigrants from Western Asia vs Immigrants from Haiti Disability Age 18 to 34 Correlation Chart
The statistical analysis conducted on geographies consisting of 403,567,862 people shows a weak negative correlation between the proportion of Immigrants from Western Asia and percentage of population with a disability between the ages 18 and 35 in the United States with a correlation coefficient (R) of -0.241 and weighted average of 6.1%. Similarly, the statistical analysis conducted on geographies consisting of 225,012,435 people shows a poor negative correlation between the proportion of Immigrants from Haiti and percentage of population with a disability between the ages 18 and 35 in the United States with a correlation coefficient (R) of -0.127 and weighted average of 5.9%, a difference of 2.3%.
Disability Age 18 to 34 Correlation Summary
| Measurement | Immigrants from Western Asia | Immigrants from Haiti |
| Minimum | 2.5% | 1.4% |
| Maximum | 8.7% | 12.1% |
| Range | 6.3% | 10.8% |
| Mean | 5.4% | 5.7% |
| Median | 5.5% | 5.7% |
| Interquartile 25% (IQ1) | 4.1% | 4.9% |
| Interquartile 75% (IQ3) | 6.4% | 6.6% |
| Interquartile Range (IQR) | 2.2% | 1.7% |
| Standard Deviation (Sample) | 1.4% | 1.7% |
| Standard Deviation (Population) | 1.4% | 1.7% |
Demographics Similar to Immigrants from Western Asia and Immigrants from Haiti by Disability Age 18 to 34
In terms of disability age 18 to 34, the demographic groups most similar to Immigrants from Western Asia are Immigrants from Turkey (6.1%, a difference of 0.28%), Haitian (6.0%, a difference of 0.58%), Immigrants from Lebanon (6.0%, a difference of 0.66%), Cypriot (6.0%, a difference of 0.66%), and Immigrants from Japan (6.0%, a difference of 0.78%). Similarly, the demographic groups most similar to Immigrants from Haiti are Immigrants from Serbia (5.9%, a difference of 0.020%), Paraguayan (5.9%, a difference of 0.11%), Immigrants from Caribbean (6.0%, a difference of 0.16%), Immigrants from Sri Lanka (6.0%, a difference of 0.16%), and British West Indian (6.0%, a difference of 0.42%).
| Demographics | Rating | Rank | Disability Age 18 to 34 |
| Paraguayans | 99.7 /100 | #56 | Exceptional 5.9% |
| Immigrants | Haiti | 99.7 /100 | #57 | Exceptional 5.9% |
| Immigrants | Serbia | 99.7 /100 | #58 | Exceptional 5.9% |
| Immigrants | Caribbean | 99.6 /100 | #59 | Exceptional 6.0% |
| Immigrants | Sri Lanka | 99.6 /100 | #60 | Exceptional 6.0% |
| British West Indians | 99.6 /100 | #61 | Exceptional 6.0% |
| Peruvians | 99.6 /100 | #62 | Exceptional 6.0% |
| Salvadorans | 99.6 /100 | #63 | Exceptional 6.0% |
| Taiwanese | 99.6 /100 | #64 | Exceptional 6.0% |
| Trinidadians and Tobagonians | 99.5 /100 | #65 | Exceptional 6.0% |
| Burmese | 99.5 /100 | #66 | Exceptional 6.0% |
| Immigrants | North Macedonia | 99.5 /100 | #67 | Exceptional 6.0% |
| Immigrants | Poland | 99.5 /100 | #68 | Exceptional 6.0% |
| Immigrants | West Indies | 99.4 /100 | #69 | Exceptional 6.0% |
| Immigrants | Greece | 99.4 /100 | #70 | Exceptional 6.0% |
| Immigrants | Japan | 99.3 /100 | #71 | Exceptional 6.0% |
| Immigrants | Lebanon | 99.2 /100 | #72 | Exceptional 6.0% |
| Cypriots | 99.2 /100 | #73 | Exceptional 6.0% |
| Haitians | 99.2 /100 | #74 | Exceptional 6.0% |
| Immigrants | Turkey | 99.1 /100 | #75 | Exceptional 6.1% |
| Immigrants | Western Asia | 98.9 /100 | #76 | Exceptional 6.1% |