Immigrants from West Indies vs Iraqi Disability Age 35 to 64
COMPARE
Immigrants from West Indies
Iraqi
Disability Age 35 to 64
Disability Age 35 to 64 Comparison
Immigrants from West Indies
Iraqis
11.8%
DISABILITY AGE 35 TO 64
8.9/ 100
METRIC RATING
220th/ 347
METRIC RANK
11.5%
DISABILITY AGE 35 TO 64
24.2/ 100
METRIC RATING
196th/ 347
METRIC RANK
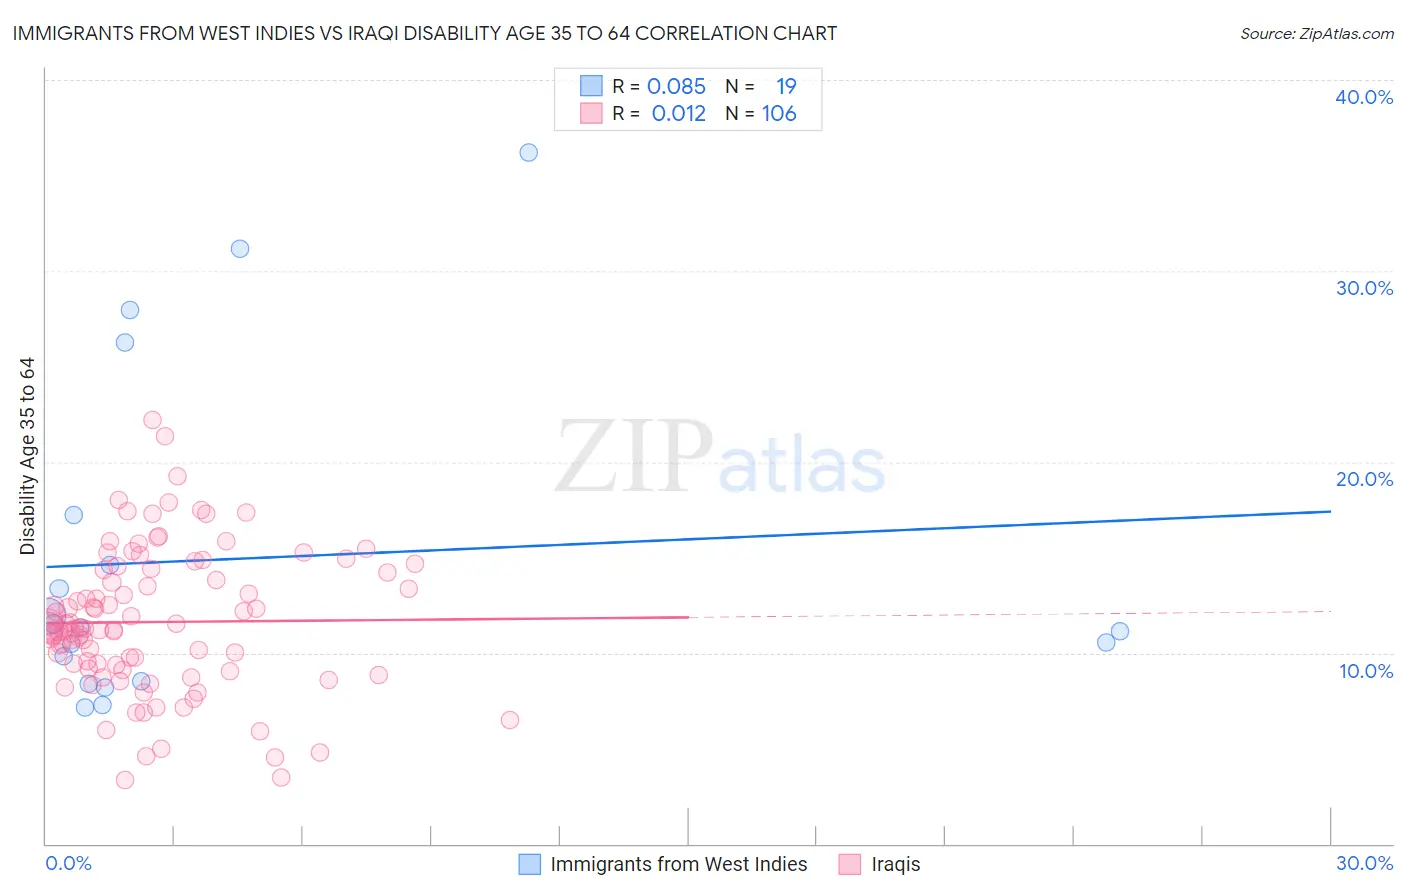
Immigrants from West Indies vs Iraqi Disability Age 35 to 64 Correlation Chart
The statistical analysis conducted on geographies consisting of 72,454,628 people shows a slight positive correlation between the proportion of Immigrants from West Indies and percentage of population with a disability between the ages 34 and 64 in the United States with a correlation coefficient (R) of 0.085 and weighted average of 11.8%. Similarly, the statistical analysis conducted on geographies consisting of 170,630,183 people shows no correlation between the proportion of Iraqis and percentage of population with a disability between the ages 34 and 64 in the United States with a correlation coefficient (R) of 0.012 and weighted average of 11.5%, a difference of 2.3%.
Disability Age 35 to 64 Correlation Summary
| Measurement | Immigrants from West Indies | Iraqi |
| Minimum | 7.1% | 3.3% |
| Maximum | 36.2% | 22.2% |
| Range | 29.1% | 18.8% |
| Mean | 14.9% | 11.6% |
| Median | 11.4% | 11.3% |
| Interquartile 25% (IQ1) | 8.5% | 9.1% |
| Interquartile 75% (IQ3) | 17.2% | 14.3% |
| Interquartile Range (IQR) | 8.7% | 5.2% |
| Standard Deviation (Sample) | 8.8% | 3.7% |
| Standard Deviation (Population) | 8.5% | 3.7% |
Similar Demographics by Disability Age 35 to 64
Demographics Similar to Immigrants from West Indies by Disability Age 35 to 64
In terms of disability age 35 to 64, the demographic groups most similar to Immigrants from West Indies are Czechoslovakian (11.8%, a difference of 0.050%), Immigrants from Bahamas (11.8%, a difference of 0.090%), Alsatian (11.8%, a difference of 0.090%), Honduran (11.8%, a difference of 0.10%), and Immigrants from Honduras (11.8%, a difference of 0.11%).
| Demographics | Rating | Rank | Disability Age 35 to 64 |
| Yugoslavians | 11.6 /100 | #213 | Poor 11.7% |
| Immigrants | Sudan | 11.4 /100 | #214 | Poor 11.7% |
| Spanish American Indians | 11.1 /100 | #215 | Poor 11.7% |
| Bahamians | 10.7 /100 | #216 | Poor 11.8% |
| Barbadians | 9.5 /100 | #217 | Tragic 11.8% |
| Immigrants | Bahamas | 9.2 /100 | #218 | Tragic 11.8% |
| Czechoslovakians | 9.0 /100 | #219 | Tragic 11.8% |
| Immigrants | West Indies | 8.9 /100 | #220 | Tragic 11.8% |
| Alsatians | 8.5 /100 | #221 | Tragic 11.8% |
| Hondurans | 8.4 /100 | #222 | Tragic 11.8% |
| Immigrants | Honduras | 8.4 /100 | #223 | Tragic 11.8% |
| Immigrants | Ghana | 7.8 /100 | #224 | Tragic 11.8% |
| Immigrants | Belize | 6.6 /100 | #225 | Tragic 11.9% |
| Scandinavians | 6.4 /100 | #226 | Tragic 11.9% |
| Immigrants | Central America | 6.3 /100 | #227 | Tragic 11.9% |
Demographics Similar to Iraqis by Disability Age 35 to 64
In terms of disability age 35 to 64, the demographic groups most similar to Iraqis are Carpatho Rusyn (11.5%, a difference of 0.12%), Immigrants from Latin America (11.5%, a difference of 0.34%), Immigrants from Iraq (11.6%, a difference of 0.36%), Immigrants from Panama (11.6%, a difference of 0.43%), and Immigrants from Africa (11.5%, a difference of 0.49%).
| Demographics | Rating | Rank | Disability Age 35 to 64 |
| Hungarians | 34.6 /100 | #189 | Fair 11.4% |
| Immigrants | Nigeria | 32.5 /100 | #190 | Fair 11.4% |
| Swedes | 31.3 /100 | #191 | Fair 11.4% |
| Norwegians | 29.7 /100 | #192 | Fair 11.5% |
| Immigrants | Africa | 29.0 /100 | #193 | Fair 11.5% |
| Immigrants | Latin America | 27.5 /100 | #194 | Fair 11.5% |
| Carpatho Rusyns | 25.3 /100 | #195 | Fair 11.5% |
| Iraqis | 24.2 /100 | #196 | Fair 11.5% |
| Immigrants | Iraq | 21.0 /100 | #197 | Fair 11.6% |
| Immigrants | Panama | 20.4 /100 | #198 | Fair 11.6% |
| Basques | 19.5 /100 | #199 | Poor 11.6% |
| Swiss | 18.7 /100 | #200 | Poor 11.6% |
| Immigrants | Kenya | 17.7 /100 | #201 | Poor 11.6% |
| Immigrants | Guatemala | 17.5 /100 | #202 | Poor 11.6% |
| British | 17.0 /100 | #203 | Poor 11.6% |